


Amidst renewed geopolitical tensions and energy market volatility, global markets have experienced mixed performance, with U.S. indices showing resilience in sectors like technology while European and Asian markets faced declines. As investors navigate this uncertain landscape, dividend stocks offering attractive yields can provide a steady income stream, particularly when market conditions are volatile. A good dividend stock typically combines a reliable payout history with the potential for capital appreciation, making it an appealing choice for those seeking stability in tumultuous times.
Top 10 Dividend Stocks Globally
| Name | Dividend Yield | Dividend Rating |
| Telekom Austria (WBAG:TKA) | 4.20% | ★★★★★★ |
| Swiss Re (SWX:SREN) | 4.88% | ★★★★★★ |
| SIGMAXYZ Holdings (TSE:6088) | 4.50% | ★★★★★★ |
| Sakai Moving ServiceLtd (TSE:9039) | 4.02% | ★★★★★★ |
| NCD (TSE:4783) | 4.91% | ★★★★★★ |
| HUAYU Automotive Systems (SHSE:600741) | 6.27% | ★★★★★★ |
| GakkyushaLtd (TSE:9769) | 4.96% | ★★★★★★ |
| Changjiang Publishing & MediaLtd (SHSE:600757) | 5.50% | ★★★★★★ |
| Business Brain Showa-Ota (TSE:9658) | 4.57% | ★★★★★★ |
| Binggrae (KOSE:A005180) | 4.98% | ★★★★★★ |
Click here to see the full list of 1368 stocks from our Top Global Dividend Stocks screener.
We're going to check out a few of the best picks from our screener tool.
Shanghai Kaibao PharmaceuticalLtd (SZSE:300039)
Simply Wall St Dividend Rating: ★★★★☆☆
Overview: Shanghai Kaibao Pharmaceutical Co., Ltd focuses on the research, development, production, and sale of modern traditional Chinese medicines primarily in China, with a market cap of CN¥4.70 billion.
Operations: Shanghai Kaibao Pharmaceutical Co., Ltd generates its revenue primarily from the research, development, production, and sale of modern traditional Chinese medicines within China.
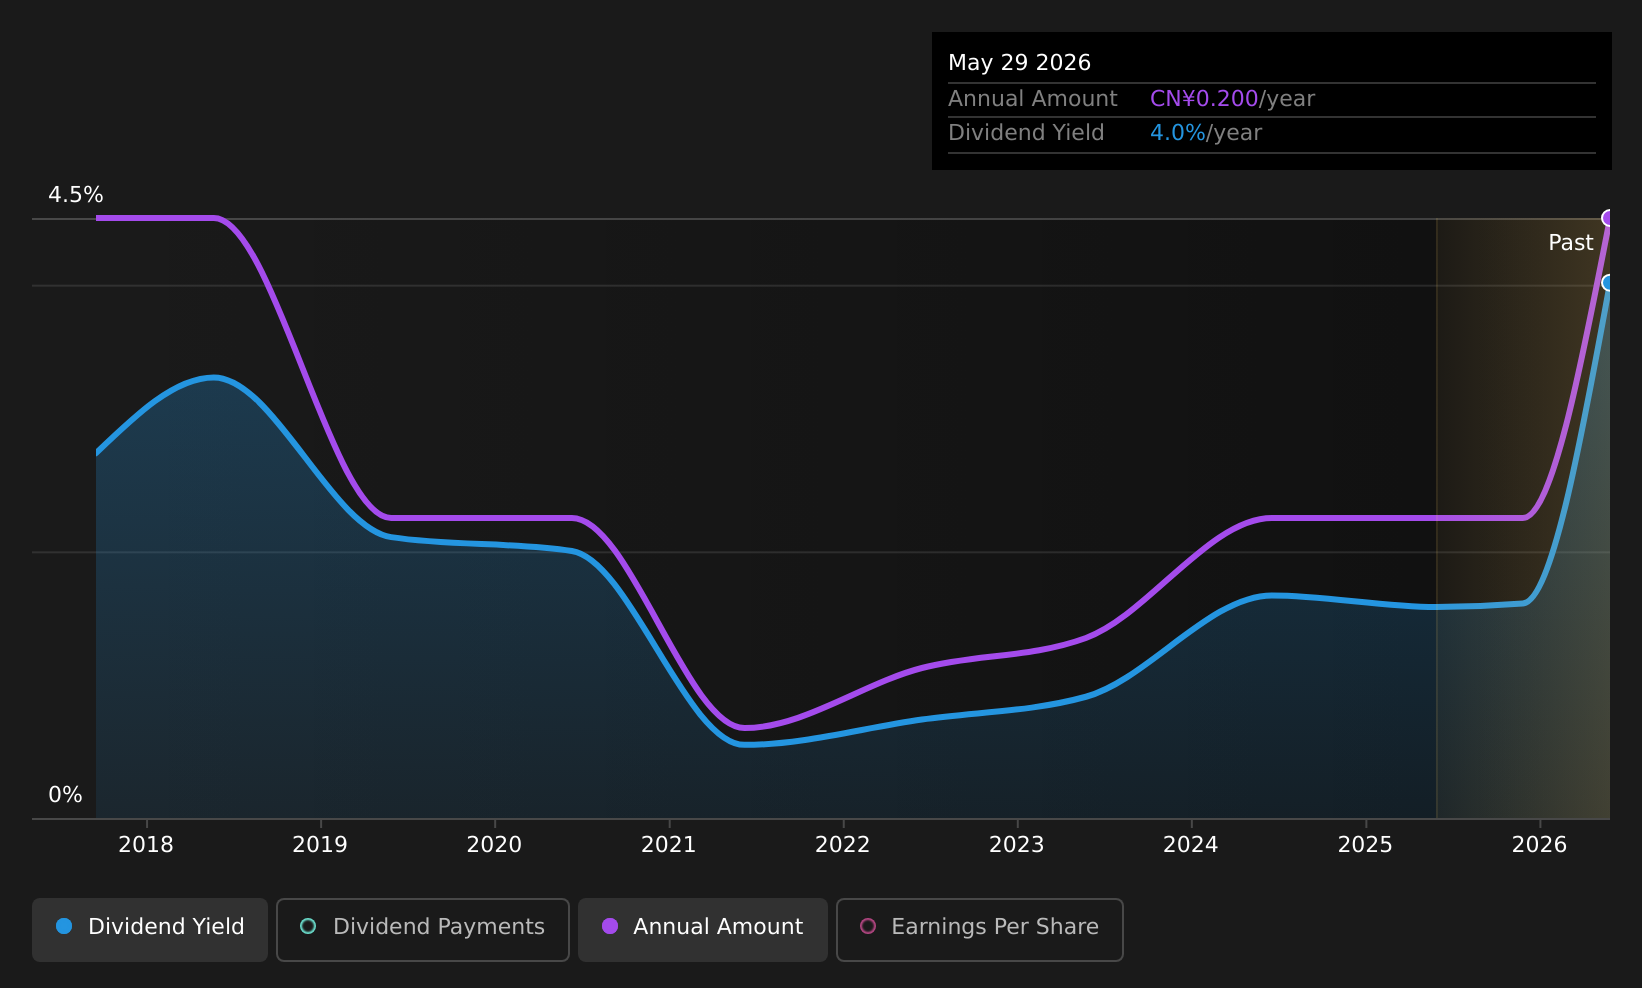
Dividend Yield: 3.8%
Shanghai Kaibao Pharmaceutical announced a final cash dividend of CNY 1 per 10 shares for 2025, with a strong yield of 3.85%, placing it in the top quartile among Chinese dividend payers. However, its dividends are not well covered by free cash flow due to a high cash payout ratio of 125.8%. Despite being reasonably covered by earnings with a payout ratio of 52.5%, past dividend payments have been volatile and unreliable over the last decade.
- Get an in-depth perspective on Shanghai Kaibao PharmaceuticalLtd's performance by reading our dividend report here.
- The analysis detailed in our Shanghai Kaibao PharmaceuticalLtd valuation report hints at an inflated share price compared to its estimated value.
Art Vivant (TSE:7523)
Simply Wall St Dividend Rating: ★★★★☆☆
Overview: Art Vivant Co., Ltd. operates in the art business and has a market capitalization of ¥16.42 billion.
Operations: Art Vivant Co., Ltd.'s revenue segments are not specified in the provided text.
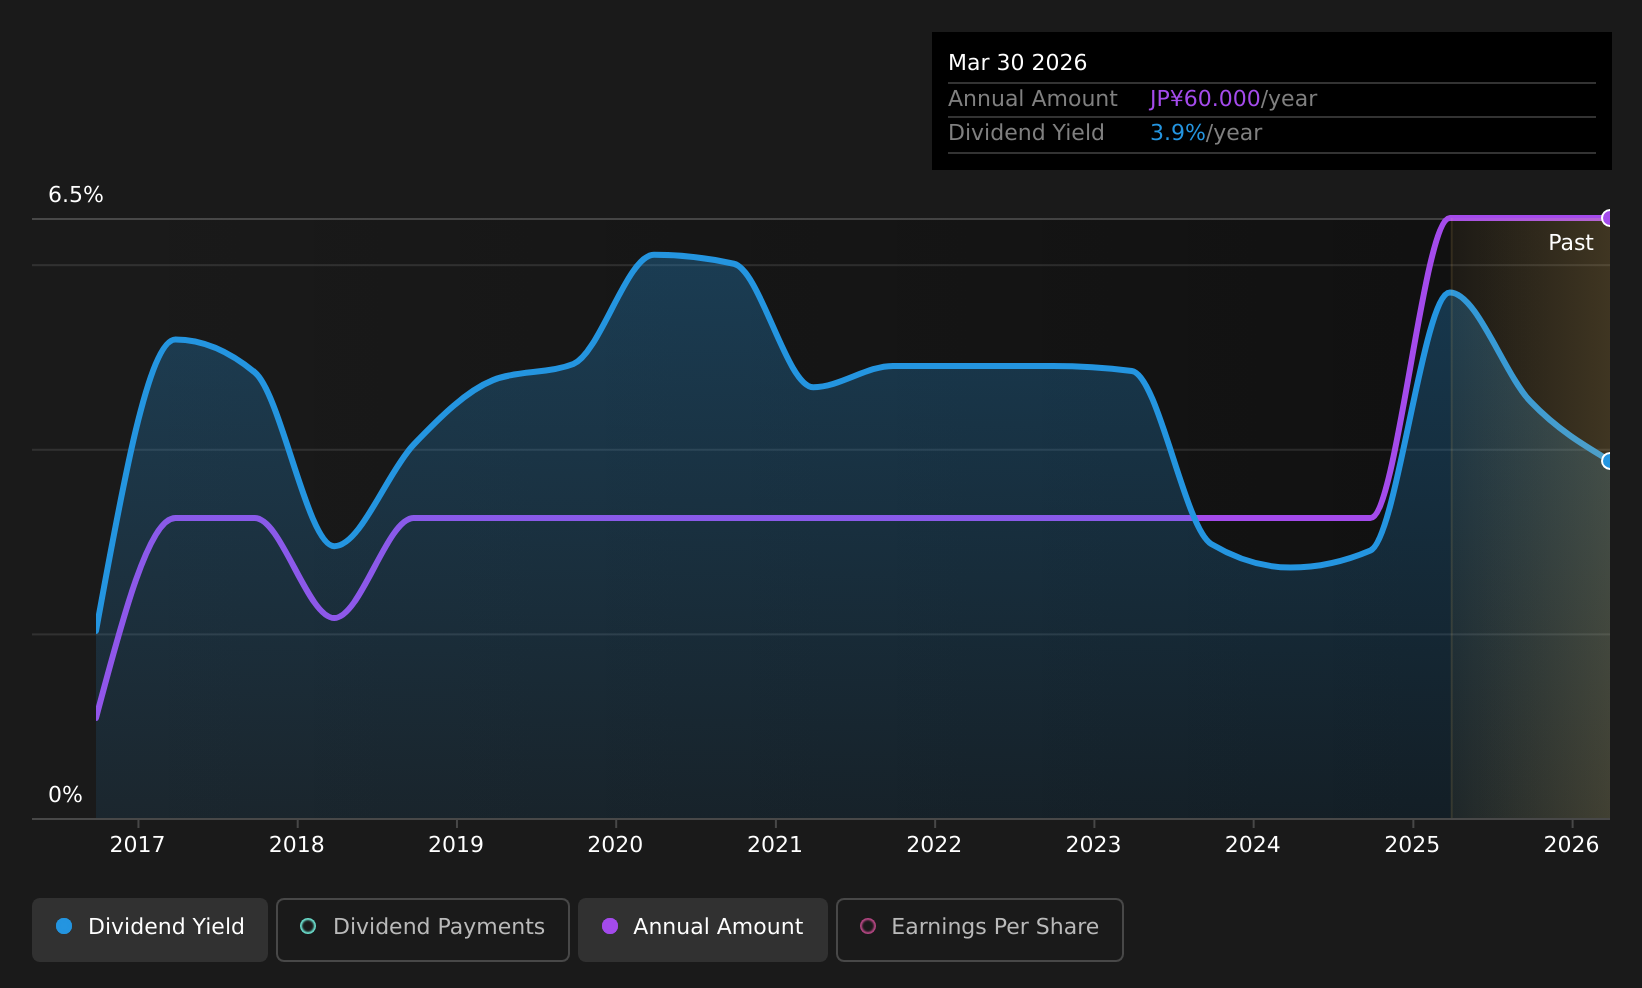
Dividend Yield: 3.2%
Art Vivant's dividend yield of 3.16% falls short of the top quartile in Japan, but its low payout ratio of 19.1% ensures dividends are well supported by earnings and cash flows (cash payout ratio: 14.8%). Despite a decade-long increase in dividend payments, their stability is questionable due to past volatility and unreliability, with annual drops exceeding 20%. The stock trades at a significant discount to its estimated fair value.
- Dive into the specifics of Art Vivant here with our thorough dividend report.
- Our comprehensive valuation report raises the possibility that Art Vivant is priced lower than what may be justified by its financials.
Eclat Textile (TWSE:1476)
Simply Wall St Dividend Rating: ★★★★☆☆
Overview: Eclat Textile Co., Ltd. is involved in the design, manufacturing, processing, dyeing, trading, marketing, and sale of elastic knitted fabrics and garments both in Taiwan and internationally, with a market cap of NT$91.91 billion.
Operations: Eclat Textile Co., Ltd.'s revenue is primarily derived from its Knitting Division, which contributes NT$20.19 billion, and its Apparels Division, which adds NT$31.20 billion.
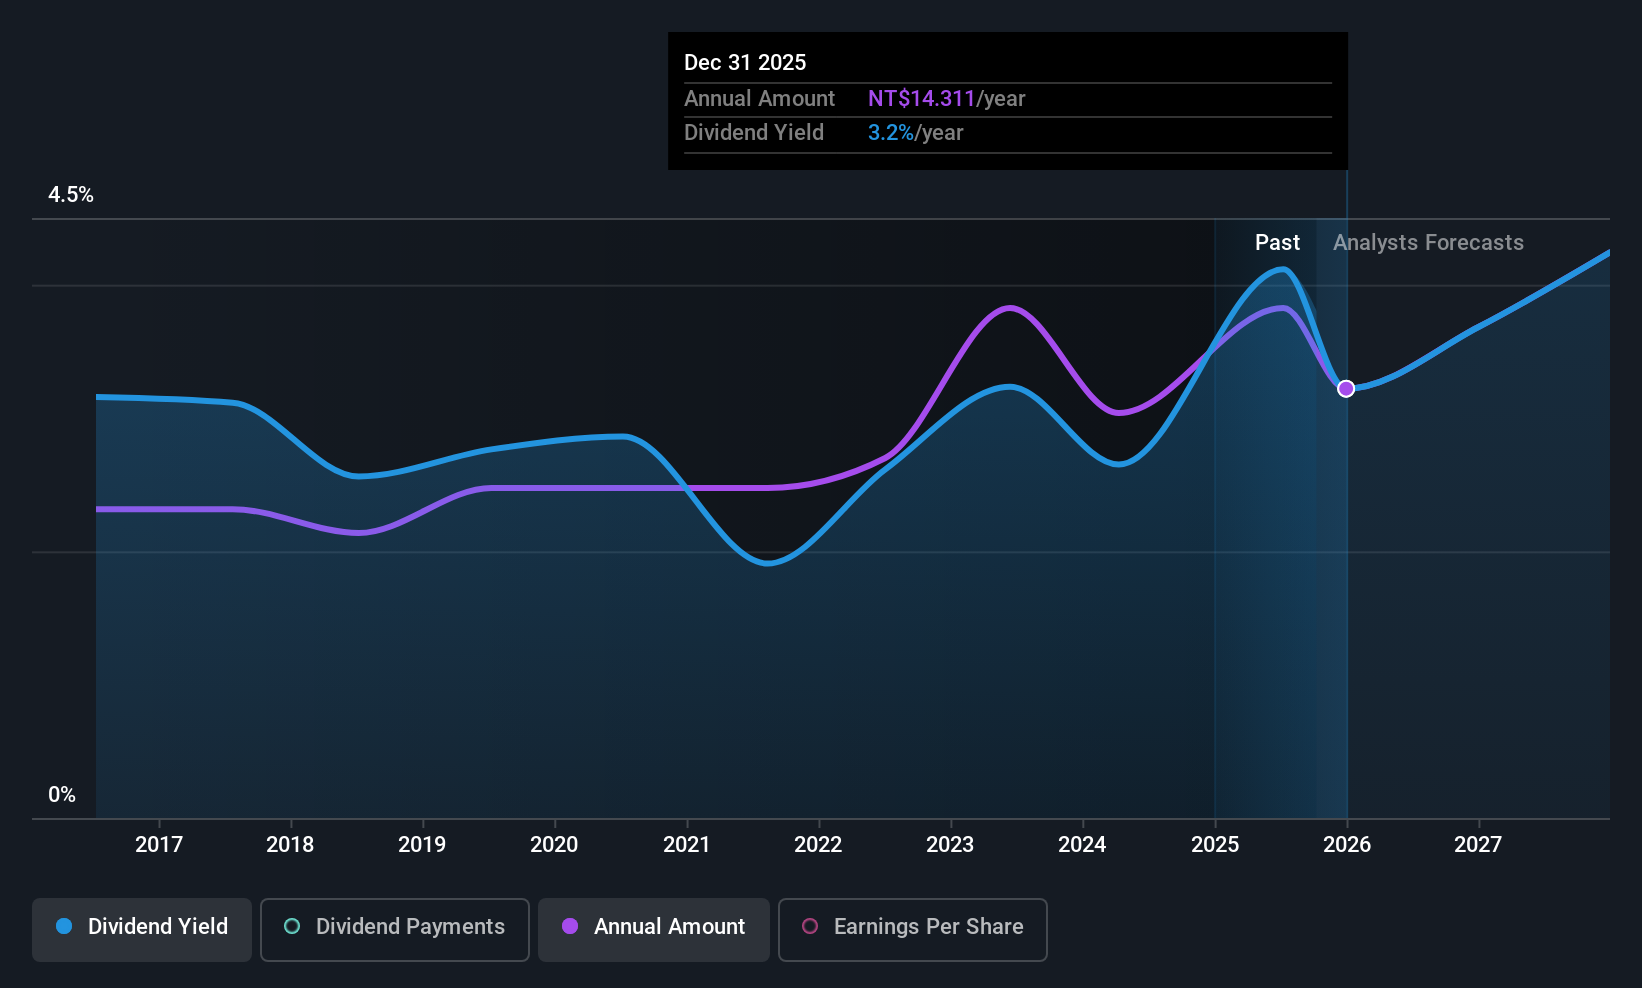
Dividend Yield: 4.4%
Eclat Textile's dividend yield of 4.37% is below Taiwan's top quartile, and its dividend track record is unstable with past volatility. Despite this, dividends are covered by earnings (payout ratio: 72.6%) and cash flows (cash payout ratio: 50.2%). The company reported Q1 sales of TWD 9.62 billion and net income of TWD 1.83 billion, showing growth from the previous year, while trading at a discount to estimated fair value enhances its appeal for value investors.
- Click here and access our complete dividend analysis report to understand the dynamics of Eclat Textile.
- Insights from our recent valuation report point to the potential overvaluation of Eclat Textile shares in the market.
Taking Advantage
- Embark on your investment journey to our 1368 Top Global Dividend Stocks selection here.
- Shareholder in one or more of these companies? Ensure you're never caught off-guard by adding your portfolio in Simply Wall St for timely alerts on significant stock developments.
- Enhance your investing ability with the Simply Wall St app and enjoy free access to essential market intelligence spanning every continent.
Seeking Other Investments?
- Explore high-performing small cap companies that haven't yet garnered significant analyst attention.
- Fuel your portfolio with companies showing strong growth potential, backed by optimistic outlooks both from analysts and management.
- Find companies with promising cash flow potential yet trading below their fair value.
This article by Simply Wall St is general in nature. We provide commentary based on historical data and analyst forecasts only using an unbiased methodology and our articles are not intended to be financial advice. It does not constitute a recommendation to buy or sell any stock, and does not take account of your objectives, or your financial situation. We aim to bring you long-term focused analysis driven by fundamental data. Note that our analysis may not factor in the latest price-sensitive company announcements or qualitative material. Simply Wall St has no position in any stocks mentioned.
Have feedback on this article? Concerned about the content? Get in touch with us directly. Alternatively, email editorial-team@simplywallst.com