


As geopolitical tensions and energy market volatility weigh on European equities, the pan-European STOXX Europe 600 Index recently ended the week down 1.79%, reflecting investor concerns over inflation and potential monetary policy tightening by the European Central Bank. In this context, identifying undervalued stocks can be crucial for investors seeking opportunities amidst broader market uncertainties; companies like Tinexta may present potential value plays in a fluctuating economic landscape.
Top 10 Undervalued Stocks Based On Cash Flows In Europe
| Name | Current Price | Fair Value (Est) | Discount (Est) |
| Vossloh (XTRA:VOS) | €63.35 | €123.92 | 48.9% |
| TGS (OB:TGS) | NOK130.80 | NOK256.19 | 48.9% |
| Murapol (WSE:MUR) | PLN37.90 | PLN75.27 | 49.7% |
| Micro Systemation (OM:MSAB B) | SEK82.20 | SEK159.41 | 48.4% |
| Laboratorios Farmaceuticos Rovi (BME:ROVI) | €56.00 | €109.13 | 48.7% |
| Koskisen Oyj (HLSE:KOSKI) | €8.78 | €17.42 | 49.6% |
| Jerónimo Martins SGPS (ENXTLS:JMT) | €16.38 | €31.87 | 48.6% |
| F-Secure Oyj (HLSE:FSECURE) | €2.035 | €3.93 | 48.2% |
| Fasadgruppen Group (OM:FG) | SEK18.98 | SEK36.46 | 47.9% |
| Casta Diva Group (BIT:CDG) | €3.15 | €6.11 | 48.4% |
Let's review some notable picks from our screened stocks.
Tinexta (BIT:TNXT)
Overview: Tinexta S.p.A. and its subsidiaries offer digital trust, cybersecurity, and business innovation services across various regions including Italy, France, Spain, the rest of the EU, the United Kingdom, the UAE, and internationally with a market cap of €691.13 million.
Operations: The company's revenue is derived from three main segments: Digital Trust (€221.95 million), Business Innovation (€159.19 million), and Cybersecurity (€85.60 million).
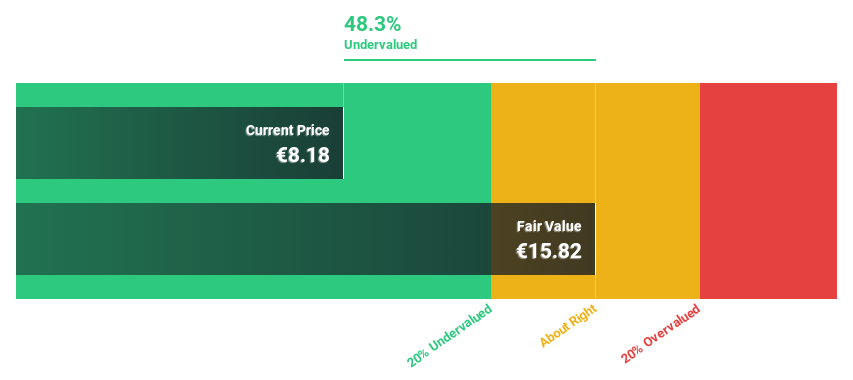
Estimated Discount To Fair Value: 27.4%
Tinexta is trading at €15.06, significantly below its estimated future cash flow value of €20.75, suggesting it may be undervalued based on cash flows. Despite a recent net loss of €5.11 million for Q1 2026, the company is forecast to become profitable over the next three years with earnings expected to grow by 125.59% annually. However, interest payments are not well covered by earnings and its dividend track record remains unstable.
- Our comprehensive growth report raises the possibility that Tinexta is poised for substantial financial growth.
- Dive into the specifics of Tinexta here with our thorough financial health report.
STIF Société anonyme (ENXTPA:ALSTI)
Overview: STIF Société anonyme manufactures and sells components for the handling of bulk products in France, with a market cap of €270.38 million.
Operations: The company's revenue is derived from several segments, including Handling Equipment (€19.60 million), Explosion Energy (BESS) (€41.40 million), US Distribution Segment (€4.40 million), Active Industry Explosion (€6.80 million), and Passive Industry Explosion (€16.60 million).
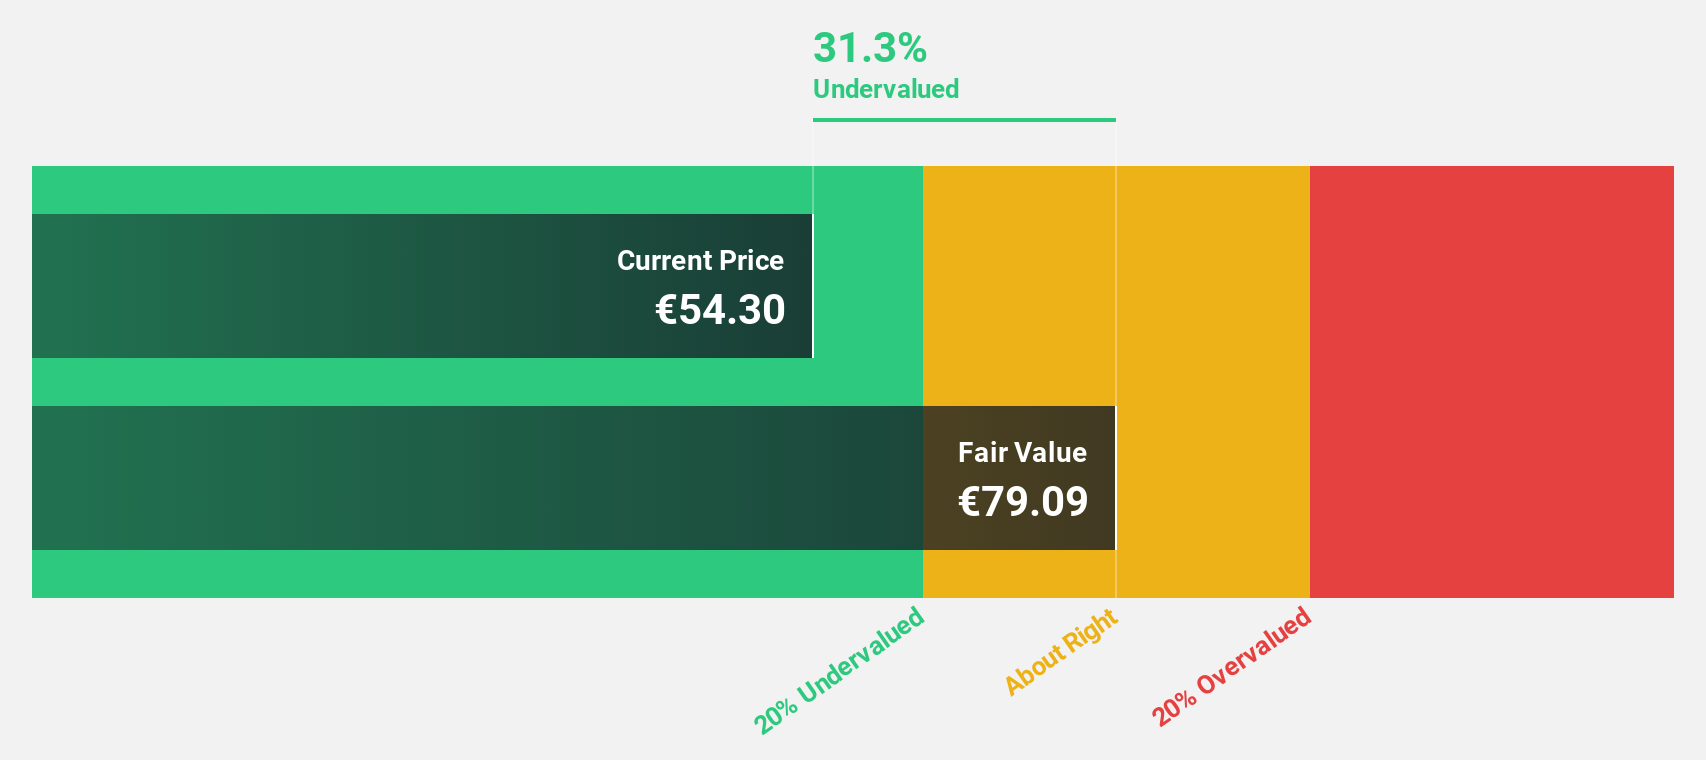
Estimated Discount To Fair Value: 45.9%
STIF Société anonyme, priced at €52.65, is currently trading substantially below its projected future cash flow value of €97.27, reflecting potential undervaluation based on cash flows. The company has demonstrated robust earnings growth of 21.4% over the past year and is forecast to continue this trend with a 21.26% annual increase in profits, outpacing the French market's growth rate significantly despite its high debt levels.
- The analysis detailed in our STIF Société anonyme growth report hints at robust future financial performance.
- Take a closer look at STIF Société anonyme's balance sheet health here in our report.
Ratos (OM:RATO B)
Overview: Ratos AB (publ) is a private equity firm that focuses on buyouts, turnarounds, add-on acquisitions, and small to middle market transactions, with a market cap of SEK11.08 billion.
Operations: Ratos generates revenue from various segments, including {Segment Adjustment: SEK18.86 billion}.
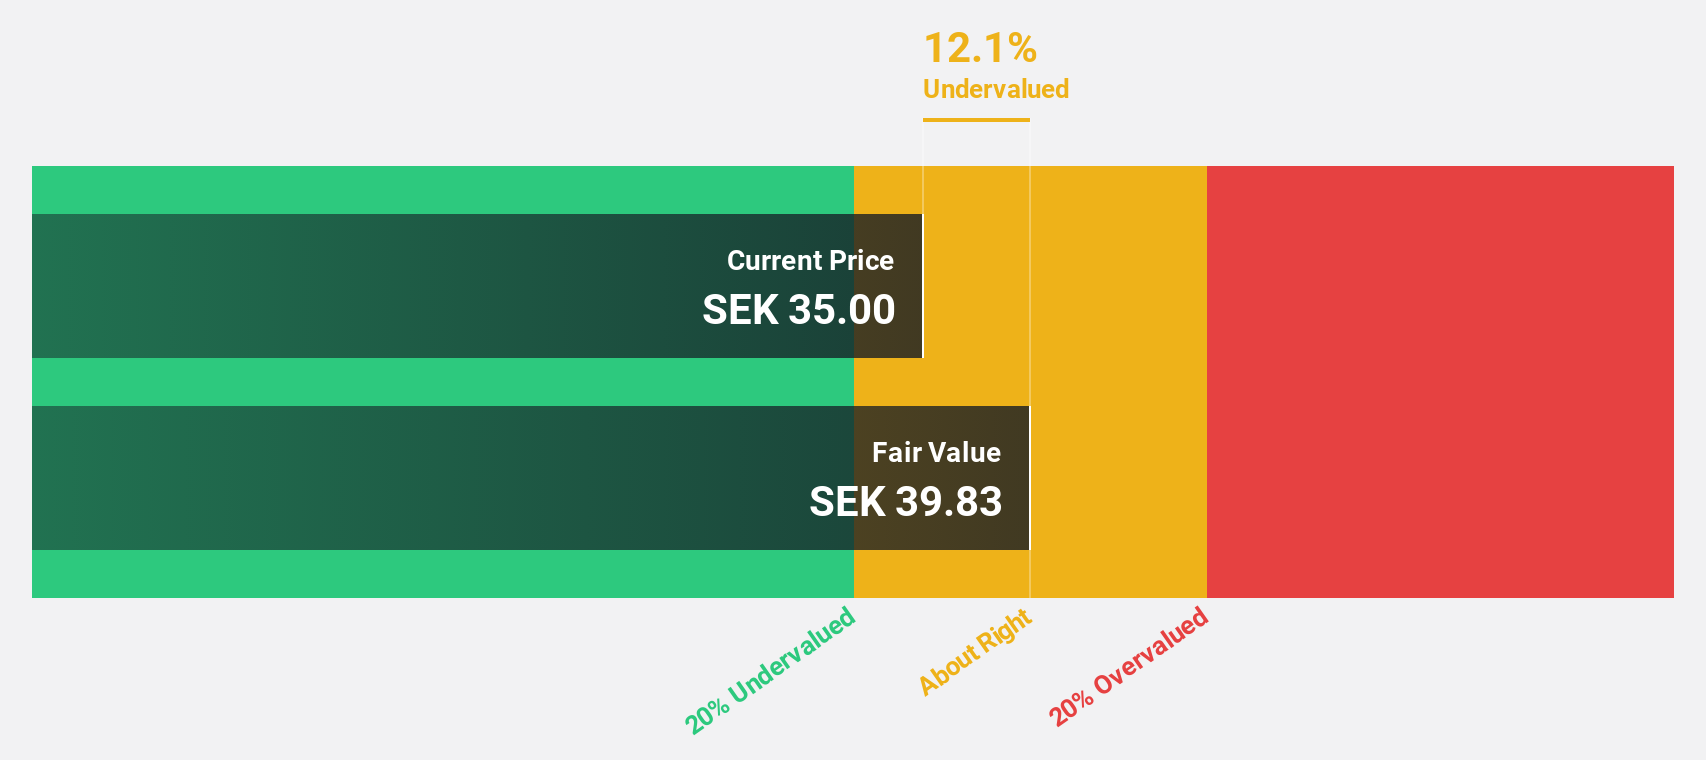
Estimated Discount To Fair Value: 38.4%
Ratos, priced at SEK33.82, is trading significantly below its estimated future cash flow value of SEK54.94, highlighting potential undervaluation based on cash flows. Despite a recent dip in net income to SEK193 million for Q1 2026 from the previous year's SEK248 million, the company is expected to achieve profitability within three years with earnings forecasted to grow by 59.08% annually, although its dividend coverage remains weak and return on equity is projected low at 8.6%.
- Our expertly prepared growth report on Ratos implies its future financial outlook may be stronger than recent results.
- Get an in-depth perspective on Ratos' balance sheet by reading our health report here.
Turning Ideas Into Actions
- Unlock our comprehensive list of 196 Undervalued European Stocks Based On Cash Flows by clicking here.
- Are these companies part of your investment strategy? Use Simply Wall St to consolidate your holdings into a portfolio and gain insights with our comprehensive analysis tools.
- Maximize your investment potential with Simply Wall St, the comprehensive app that offers global market insights for free.
Want To Explore Some Alternatives?
- Explore high-performing small cap companies that haven't yet garnered significant analyst attention.
- Diversify your portfolio with solid dividend payers offering reliable income streams to weather potential market turbulence.
- Fuel your portfolio with companies showing strong growth potential, backed by optimistic outlooks both from analysts and management.
This article by Simply Wall St is general in nature. We provide commentary based on historical data and analyst forecasts only using an unbiased methodology and our articles are not intended to be financial advice. It does not constitute a recommendation to buy or sell any stock, and does not take account of your objectives, or your financial situation. We aim to bring you long-term focused analysis driven by fundamental data. Note that our analysis may not factor in the latest price-sensitive company announcements or qualitative material. Simply Wall St has no position in any stocks mentioned.
Have feedback on this article? Concerned about the content? Get in touch with us directly. Alternatively, email editorial-team@simplywallst.com