


As global markets navigate the complexities of Middle East tensions and energy market volatility, investors are keenly observing how these factors influence stock performance across various sectors. With major indices showing mixed results and geopolitical uncertainties impacting sentiment, dividend stocks continue to attract attention for their potential to provide steady income amidst market fluctuations. In this environment, a good dividend stock is often characterized by its ability to maintain consistent payouts despite economic challenges, making it an appealing choice for those seeking reliable returns in uncertain times.
Top 10 Dividend Stocks Globally
| Name | Dividend Yield | Dividend Rating |
| Yeni Gimat Gayrimenkul Yatirim Ortakligi (IBSE:YGGYO) | 3.20% | ★★★★★★ |
| Telekom Austria (WBAG:TKA) | 4.17% | ★★★★★★ |
| Swiss Re (SWX:SREN) | 4.84% | ★★★★★★ |
| Sakai Moving ServiceLtd (TSE:9039) | 3.98% | ★★★★★★ |
| OUG Holdings (TSE:8041) | 3.87% | ★★★★★★ |
| NCD (TSE:4783) | 4.89% | ★★★★★★ |
| HUAYU Automotive Systems (SHSE:600741) | 6.19% | ★★★★★★ |
| GakkyushaLtd (TSE:9769) | 4.96% | ★★★★★★ |
| Business Brain Showa-Ota (TSE:9658) | 4.57% | ★★★★★★ |
| Binggrae (KOSE:A005180) | 5.02% | ★★★★★★ |
Click here to see the full list of 1357 stocks from our Top Global Dividend Stocks screener.
Underneath we present a selection of stocks filtered out by our screen.
Inner Mongolia Dian Tou Energy (SZSE:002128)
Simply Wall St Dividend Rating: ★★★★☆☆
Overview: Inner Mongolia Dian Tou Energy Corporation Limited, with a market cap of CN¥70.03 billion, is involved in the research, production, and sale of coal products in China through its subsidiaries.
Operations: Inner Mongolia Dian Tou Energy Corporation Limited generates its revenue primarily from the research, production, and sale of coal products within China.
Dividend Yield: 5%
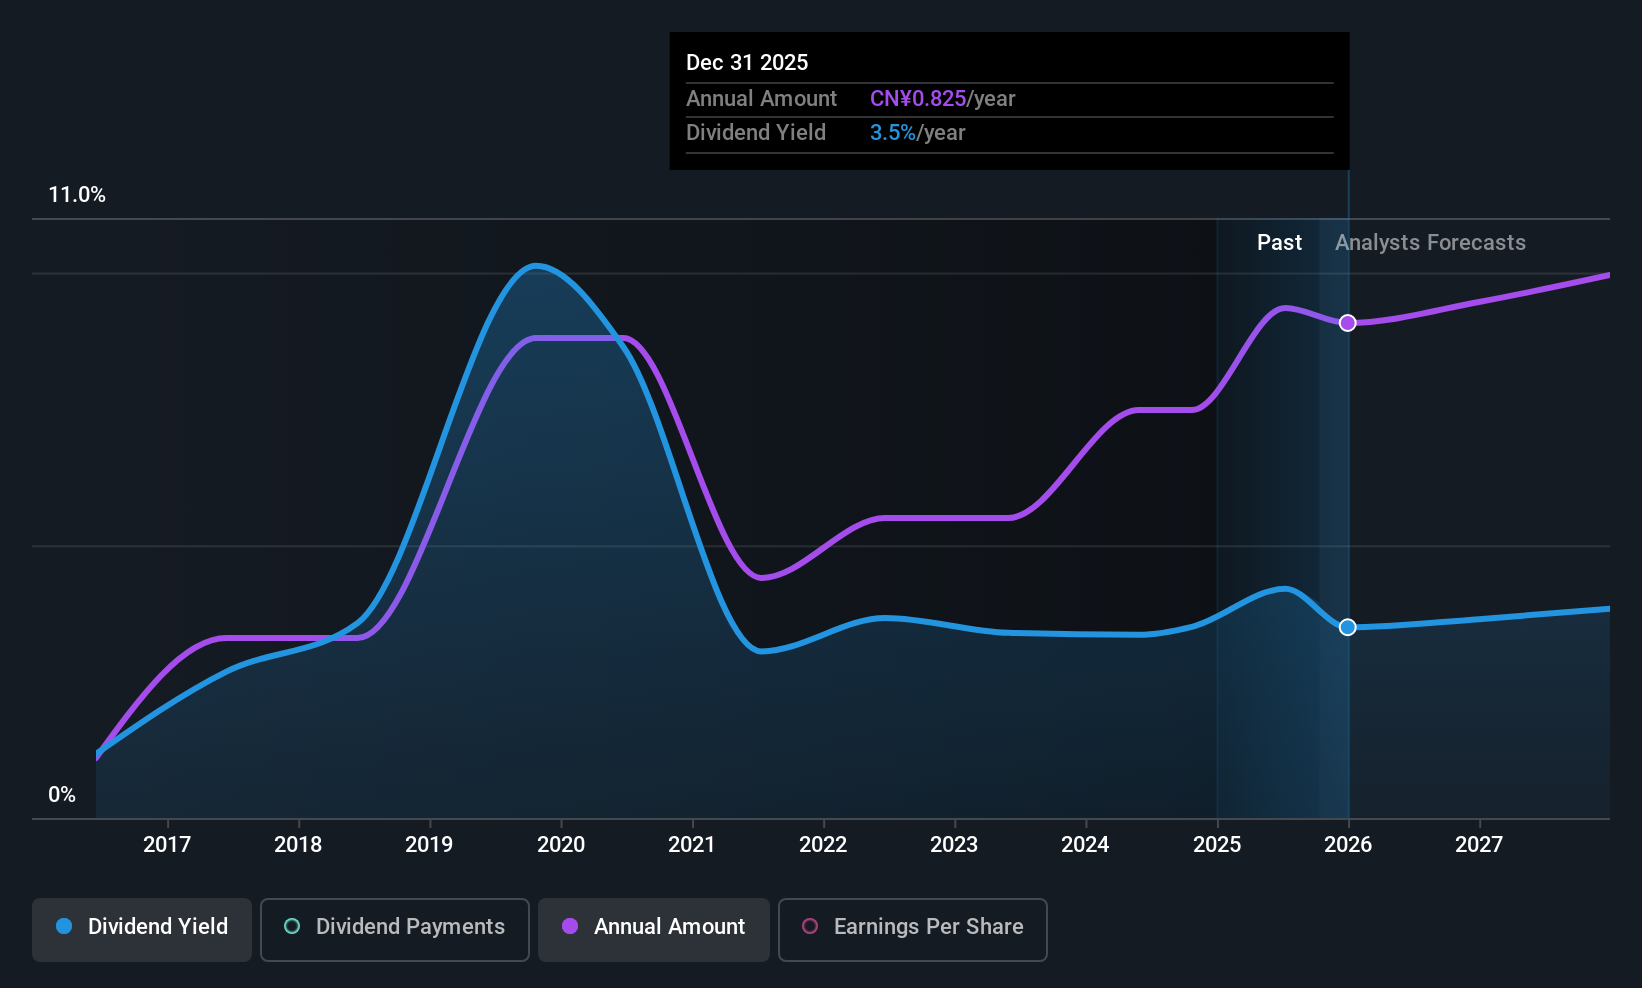
Inner Mongolia Dian Tou Energy's dividend yield of 4.98% ranks in the top 25% of CN market payers, but its stability is questionable due to past volatility and a high cash payout ratio of 133.5%. Despite a low earnings payout ratio at 49.8%, dividends aren't well covered by free cash flow, raising sustainability concerns. Recent funding through A share issuance may impact future payouts, as shareholder dilution occurred with substantial capital reserve allocation from net proceeds.
- Get an in-depth perspective on Inner Mongolia Dian Tou Energy's performance by reading our dividend report here.
- Our expertly prepared valuation report Inner Mongolia Dian Tou Energy implies its share price may be lower than expected.
WingArc1st (TSE:4432)
Simply Wall St Dividend Rating: ★★★★☆☆
Overview: WingArc1st Inc. develops and sells software and services in Japan, with a market cap of ¥87.87 billion.
Operations: WingArc1st Inc.'s revenue comes from its Data Empowerment Business, which generated ¥30.95 billion.
Dividend Yield: 3.9%
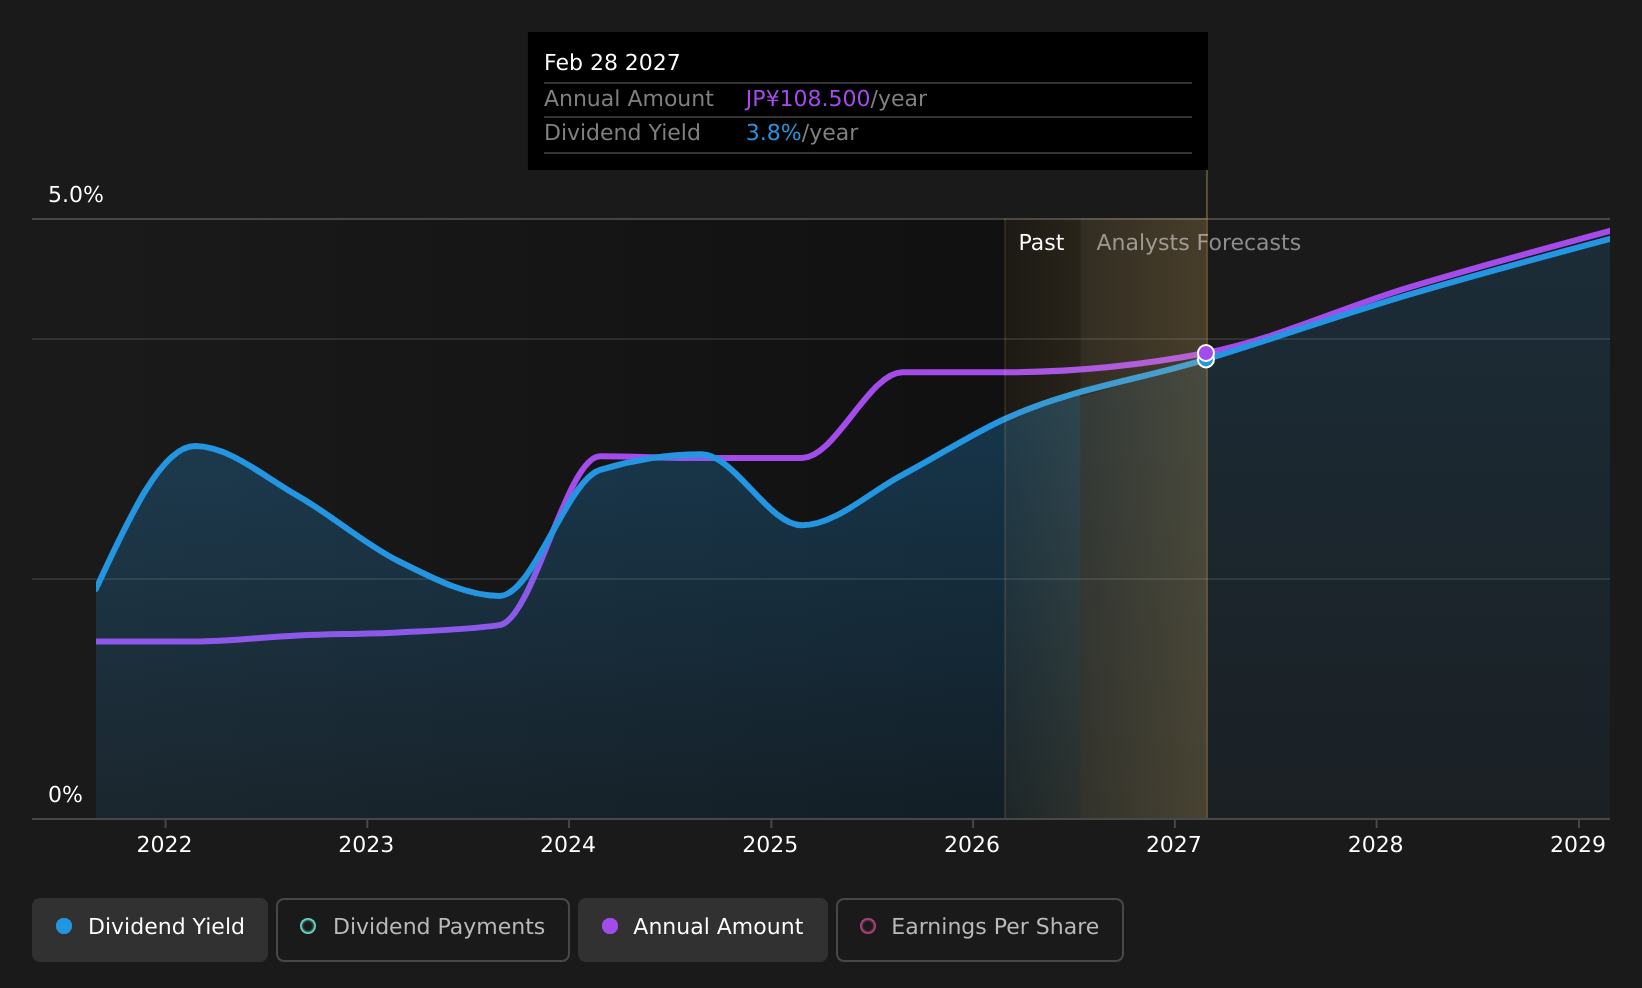
WingArc1st's dividend yield of 3.89% is among the top 25% in the Japanese market, supported by a reasonable payout ratio of 55.4%, indicating coverage by earnings and cash flows. Although dividends have been stable and growing, they have only been paid for five years, suggesting limited historical reliability. The company trades at a significant discount to its estimated fair value, enhancing its appeal as a dividend investment despite limited payment history.
- Unlock comprehensive insights into our analysis of WingArc1st stock in this dividend report.
- Our valuation report here indicates WingArc1st may be undervalued.
Yondoshi Holdings (TSE:8008)
Simply Wall St Dividend Rating: ★★★★☆☆
Overview: Yondoshi Holdings Inc. is involved in the planning, manufacture, wholesale, and retail of jewelry, apparel, bags, and other products both in Japan and internationally with a market cap of ¥45.32 billion.
Operations: Yondoshi Holdings Inc. generates its revenue primarily from its Brand segment, which accounts for ¥49.32 billion, and the Apparel Business segment, contributing ¥25.07 billion.
Dividend Yield: 3.9%
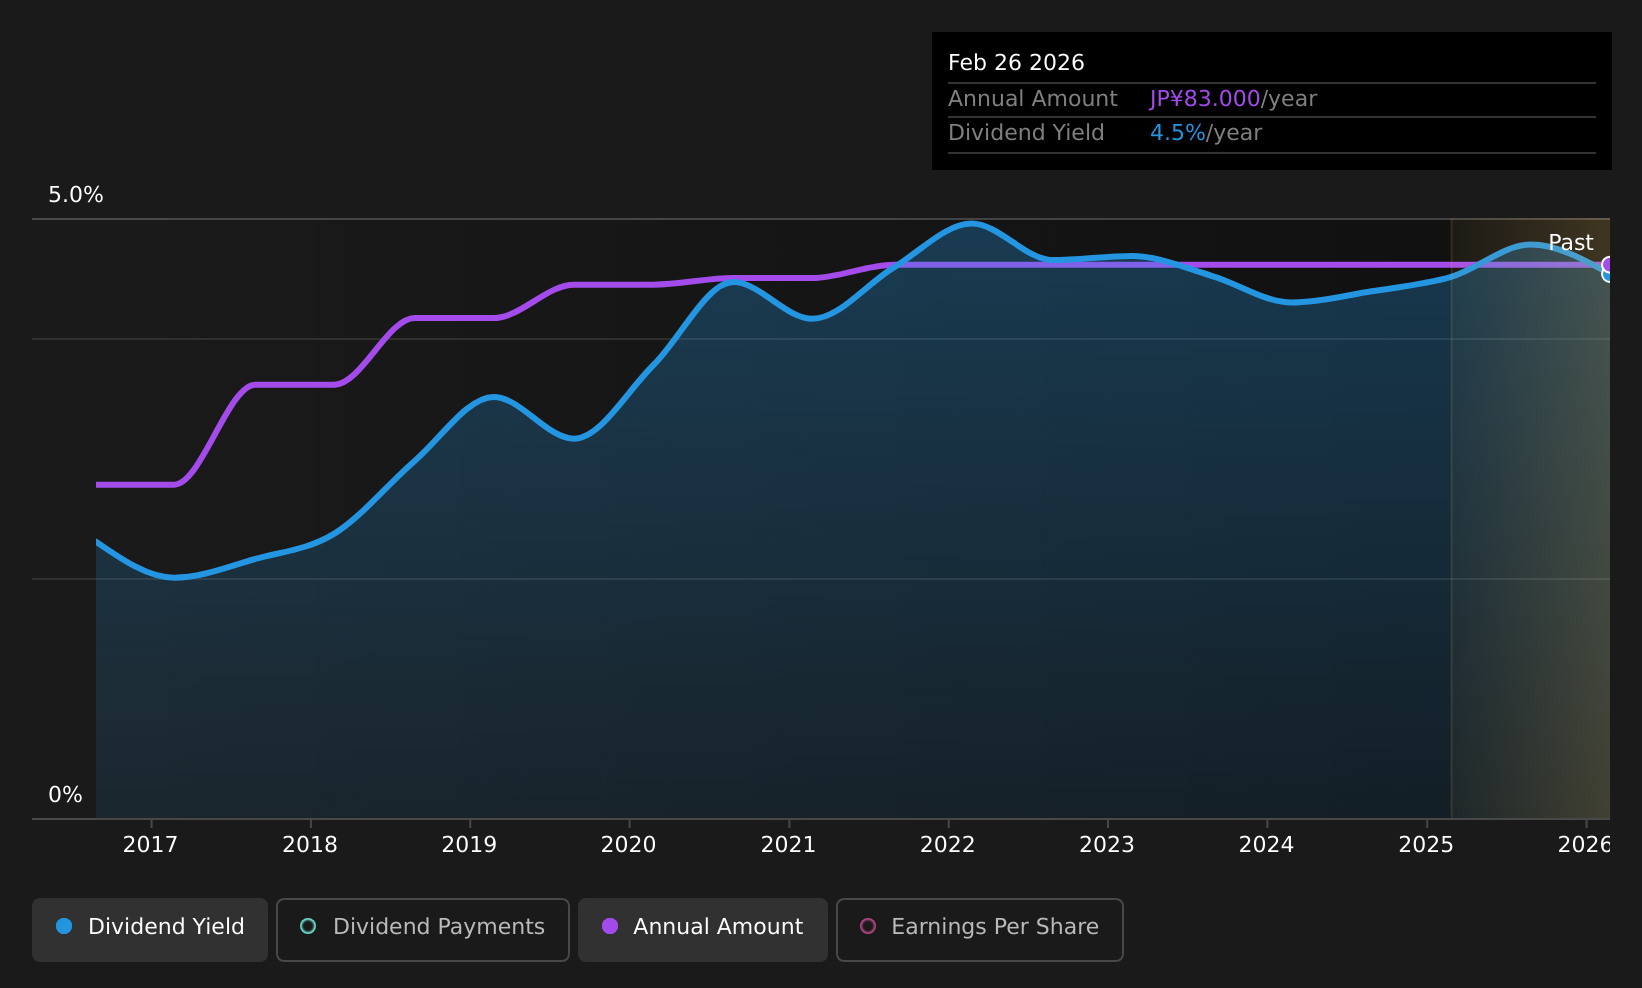
Yondoshi Holdings' dividend yield of 3.9% ranks in the top 25% of Japanese dividend payers, but its high payout and cash payout ratios suggest dividends are not well covered by earnings or cash flows, raising sustainability concerns. Despite this, dividends have been stable and growing over the past decade. Recent earnings growth and revised upward guidance for net sales and profits indicate potential financial strengthening, though coverage issues remain a critical factor for investors.
- Take a closer look at Yondoshi Holdings' potential here in our dividend report.
- Our valuation report unveils the possibility Yondoshi Holdings' shares may be trading at a premium.
Where To Now?
- Click through to start exploring the rest of the 1354 Top Global Dividend Stocks now.
- Have you diversified into these companies? Leverage the power of Simply Wall St's portfolio to keep a close eye on market movements affecting your investments.
- Invest smarter with the free Simply Wall St app providing detailed insights into every stock market around the globe.
Ready For A Different Approach?
- Explore high-performing small cap companies that haven't yet garnered significant analyst attention.
- Fuel your portfolio with companies showing strong growth potential, backed by optimistic outlooks both from analysts and management.
- Find companies with promising cash flow potential yet trading below their fair value.
This article by Simply Wall St is general in nature. We provide commentary based on historical data and analyst forecasts only using an unbiased methodology and our articles are not intended to be financial advice. It does not constitute a recommendation to buy or sell any stock, and does not take account of your objectives, or your financial situation. We aim to bring you long-term focused analysis driven by fundamental data. Note that our analysis may not factor in the latest price-sensitive company announcements or qualitative material. Simply Wall St has no position in any stocks mentioned.
Have feedback on this article? Concerned about the content? Get in touch with us directly. Alternatively, email editorial-team@simplywallst.com