


Amidst a backdrop of mixed performances in global markets, where geopolitical tensions and fluctuating energy prices have stirred volatility, small-cap stocks like those in the Russell 2000 Index have faced particular challenges with a recent decline. In such an environment, identifying promising opportunities requires looking beyond immediate market turbulence to uncover stocks that demonstrate resilience and potential for growth through strong fundamentals or unique positioning within their sectors.
Top 10 Undiscovered Gems With Strong Fundamentals Globally
| Name | Debt To Equity | Revenue Growth | Earnings Growth | Health Rating |
|---|---|---|---|---|
| CNMC Goldmine Holdings | 0.84% | 32.52% | 78.36% | ★★★★★★ |
| DeHua TB New Decoration MaterialLtd | 0.63% | 1.50% | 2.14% | ★★★★★★ |
| Nippon Carbide Industries | 16.74% | 1.99% | -4.81% | ★★★★★★ |
| Base | NA | 11.66% | 17.63% | ★★★★★★ |
| GROUPE SFPI | 18.02% | 4.25% | -29.76% | ★★★★★★ |
| Angler Gaming | NA | -5.12% | -24.26% | ★★★★★★ |
| Zhejiang Jolly PharmaceuticalLTD | 21.31% | 17.83% | 29.70% | ★★★★★☆ |
| Sing Investments & Finance | 0.15% | 7.06% | 8.65% | ★★★★☆☆ |
| Shengda ResourcesLtd | 54.08% | 7.99% | 3.75% | ★★★☆☆☆ |
| Regina Miracle International (Holdings) | 132.81% | 0.48% | -15.87% | ★★★☆☆☆ |
Let's dive into some prime choices out of from the screener.
Mota-Engil SGPS (ENXTLS:EGL)
Simply Wall St Value Rating: ★★★★☆☆
Overview: Mota-Engil SGPS, S.A. engages in public and private construction projects and related services across Europe, Africa, and Latin America, with a market capitalization of approximately €1.39 billion.
Operations: Mota-Engil SGPS derives significant revenue from its Engineering & Construction (E&C) activities, with Africa contributing €2.13 billion and Latin America €2.01 billion. The Environment segment also plays a crucial role, generating €651.86 million in revenue.
Mota-Engil, a notable player in construction, has seen its debt to equity ratio decrease significantly from 1449.3% to 313.4% over five years, yet the net debt to equity remains high at 237.9%. Interest payments are not well covered by EBIT at just 2.4 times coverage, indicating some financial strain despite high-quality past earnings and a robust annual growth rate of 46.1%. Recently, the company completed a €110 million fixed-income offering with sustainability-linked bonds and announced an increased dividend of €0.173 per share, suggesting strategic moves towards strengthening financial stability while rewarding shareholders.
- Delve into the full analysis health report here for a deeper understanding of Mota-Engil SGPS.
Review our historical performance report to gain insights into Mota-Engil SGPS''s past performance.

3S Industry Group (SHSE:605305)
Simply Wall St Value Rating: ★★★★★☆
Overview: 3S Industry Group Inc., along with its subsidiaries, operates in the wind energy, construction, and safety protection equipment sectors both within China and internationally, with a market capitalization of CN¥8.33 billion.
Operations: 3S Industry Group generates revenue primarily from the construction machinery and equipment segment, amounting to CN¥2 billion. The company's market capitalization stands at CN¥8.33 billion.
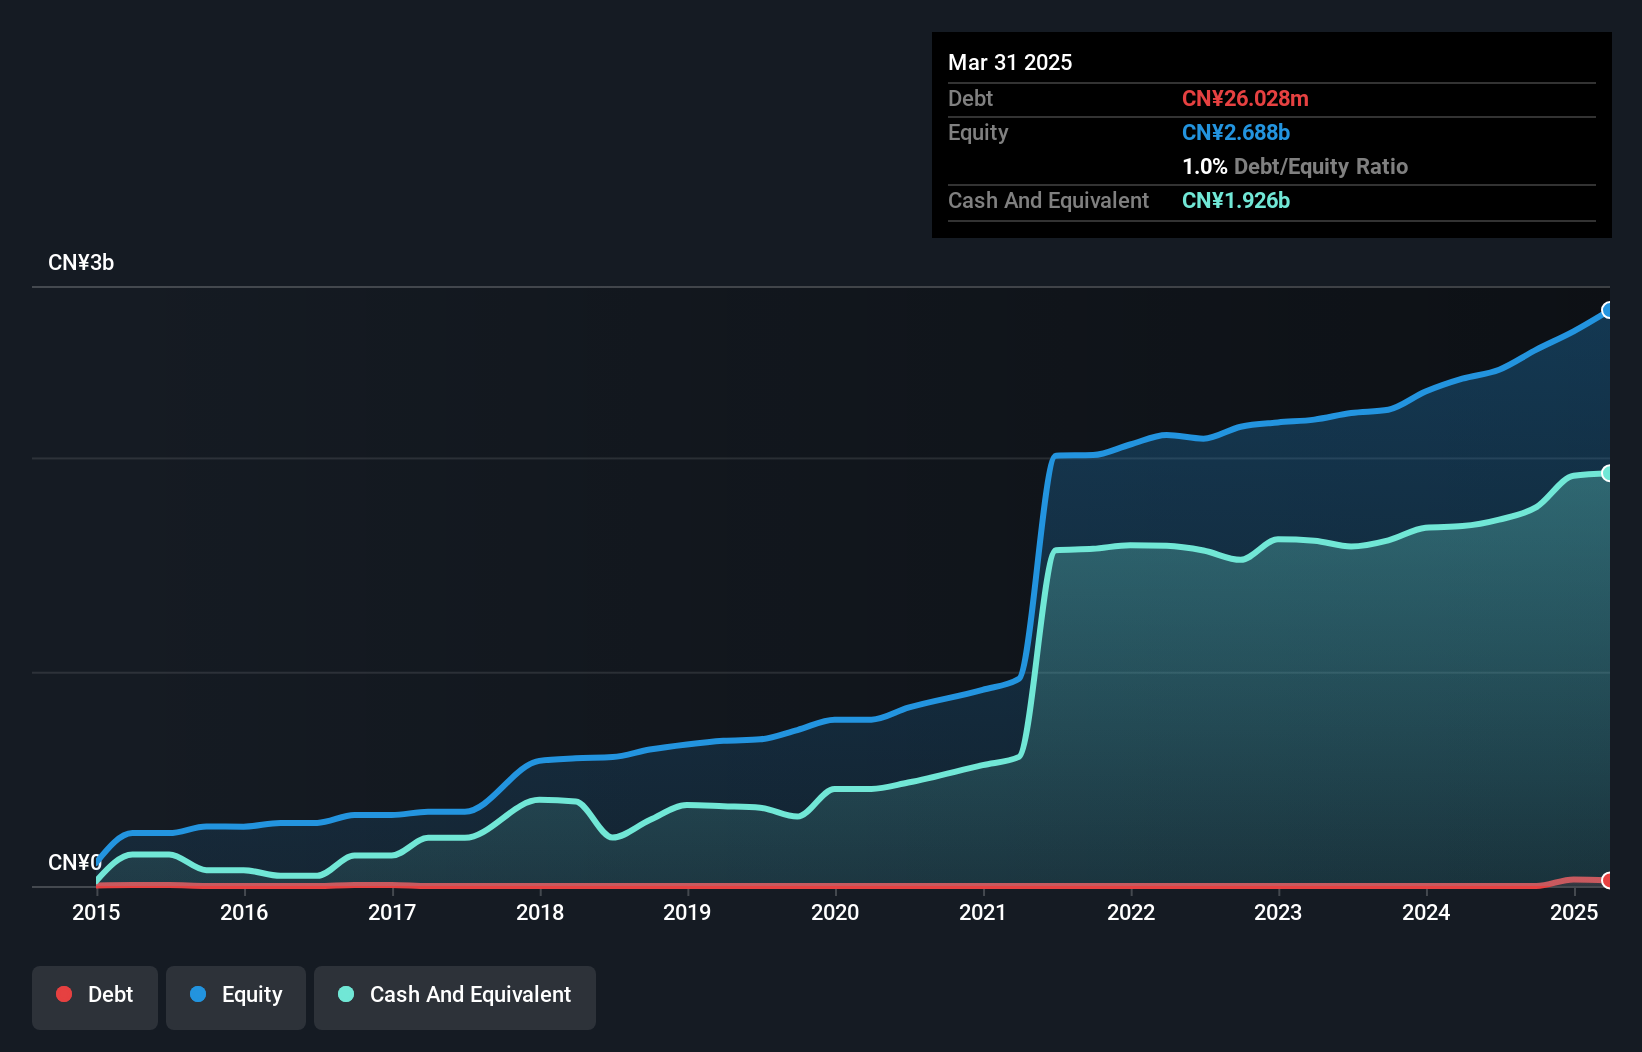
3S Industry Group, a smaller player in the machinery sector, has shown impressive growth with earnings surging 57.9% over the past year, outpacing industry averages. The company reported CNY 438.51 million in revenue for Q1 2026, up from CNY 316.81 million a year ago, alongside net income rising to CNY 128.83 million from CNY 98.54 million previously. Trading at an attractive value—42.7% below fair estimate—it boasts strong financial health with more cash than debt and positive free cash flow of CNY 207.98 million as of September 2024, indicating robust operational efficiency and promising future prospects for investors seeking growth opportunities within this niche market segment.
- Navigate through the intricacies of 3S Industry Group with our comprehensive health report here.
Assess 3S Industry Group's past performance with our detailed historical performance reports.
NEUCA (WSE:NEU)
Simply Wall St Value Rating: ★★★★☆☆
Overview: NEUCA S.A. is a company involved in the wholesale distribution of pharmaceuticals in Poland, with a market capitalization of PLN3.25 billion.
Operations: NEUCA S.A. generates revenue primarily from the wholesale distribution of drugs, which contributes PLN12.53 billion, followed by its medical operator and production of pharmaceuticals segments at PLN545.06 million and PLN490.33 million, respectively. The clinical research and insurance business add PLN463.45 million and PLN218.16 million to the revenue stream, respectively, with a segment adjustment reducing total reported figures by PLN411.30 million.
NEUCA seems to be carving out a strong position in the healthcare industry, with its earnings growth of 20.1% outpacing the sector's 4.6%. The company's net debt to equity ratio stands at a satisfactory 31.5%, indicating prudent financial management despite an increase from 21.3% over five years. Trading at 63.4% below its estimated fair value, NEUCA appears undervalued, which could attract attention from investors seeking hidden potential. Recent results show sales climbing to PLN 3,556 million and net income reaching PLN 68 million for Q1 2026, highlighting robust performance and promising future prospects in the market landscape.
- Click here and access our complete health analysis report to understand the dynamics of NEUCA.
Gain insights into NEUCA's historical performance by reviewing our past performance report.

Key Takeaways
- Navigate through the entire inventory of 151 Global Undiscovered Gems With Strong Fundamentals here.
- Got skin in the game with these stocks? Elevate how you manage them by using Simply Wall St's portfolio, where intuitive tools await to help optimize your investment outcomes.
- Maximize your investment potential with Simply Wall St, the comprehensive app that offers global market insights for free.
Ready To Venture Into Other Investment Styles?
- Explore high-performing small cap companies that haven't yet garnered significant analyst attention.
- Fuel your portfolio with companies showing strong growth potential, backed by optimistic outlooks both from analysts and management.
- Find companies with promising cash flow potential yet trading below their fair value.
This article by Simply Wall St is general in nature. We provide commentary based on historical data and analyst forecasts only using an unbiased methodology and our articles are not intended to be financial advice. It does not constitute a recommendation to buy or sell any stock, and does not take account of your objectives, or your financial situation. We aim to bring you long-term focused analysis driven by fundamental data. Note that our analysis may not factor in the latest price-sensitive company announcements or qualitative material. Simply Wall St has no position in any stocks mentioned.
Have feedback on this article? Concerned about the content? Get in touch with us directly. Alternatively, email editorial-team@simplywallst.com