


Hercules Capital stock has returned 65.3% over the past 5 years. Yet today it trades at US$16.17, while the Excess Returns intrinsic value estimate and earnings-based multiples both point to an undervalued profile, raising the question of how much of that longer-term gain is backed by current fundamentals.
- The 65.3% return over 5 years suggests Hercules Capital has rewarded patient shareholders, so the key issue is whether the current valuation still leaves a margin of safety.
- The recent ESOP equity shelf of about US$213.36m can support capital needs but also introduces dilution risk at a time when weakening earnings per share, elevated leverage and ongoing litigation allegations may weigh on how the market prices the stock.
- On Simply Wall St's broader valuation checks, Hercules Capital screens as undervalued in 5 of 6 areas. As a result, the overall framework leans toward the shares being cheap relative to the underlying estimates.
The issue now is whether Hercules Capital's current discount to intrinsic value and multiples offers enough compensation for the dilution and legal risks that investors are weighing.
Find out why Hercules Capital's -6.4% return over the last year is lagging behind its peers.
Does Hercules Capital Look Undervalued on Excess Returns?
The Excess Returns model looks at how much value Hercules Capital may create above the cost of its equity capital. For Hercules Capital, the inputs point to a stable earnings profile, with stable EPS of $1.89 per share supported by an average return on equity of 16.11% and a stable book value of $11.71 per share. With a book value of $12.08 per share and a cost of equity of $1.08 per share, the model estimates an excess return of $0.80 per share.
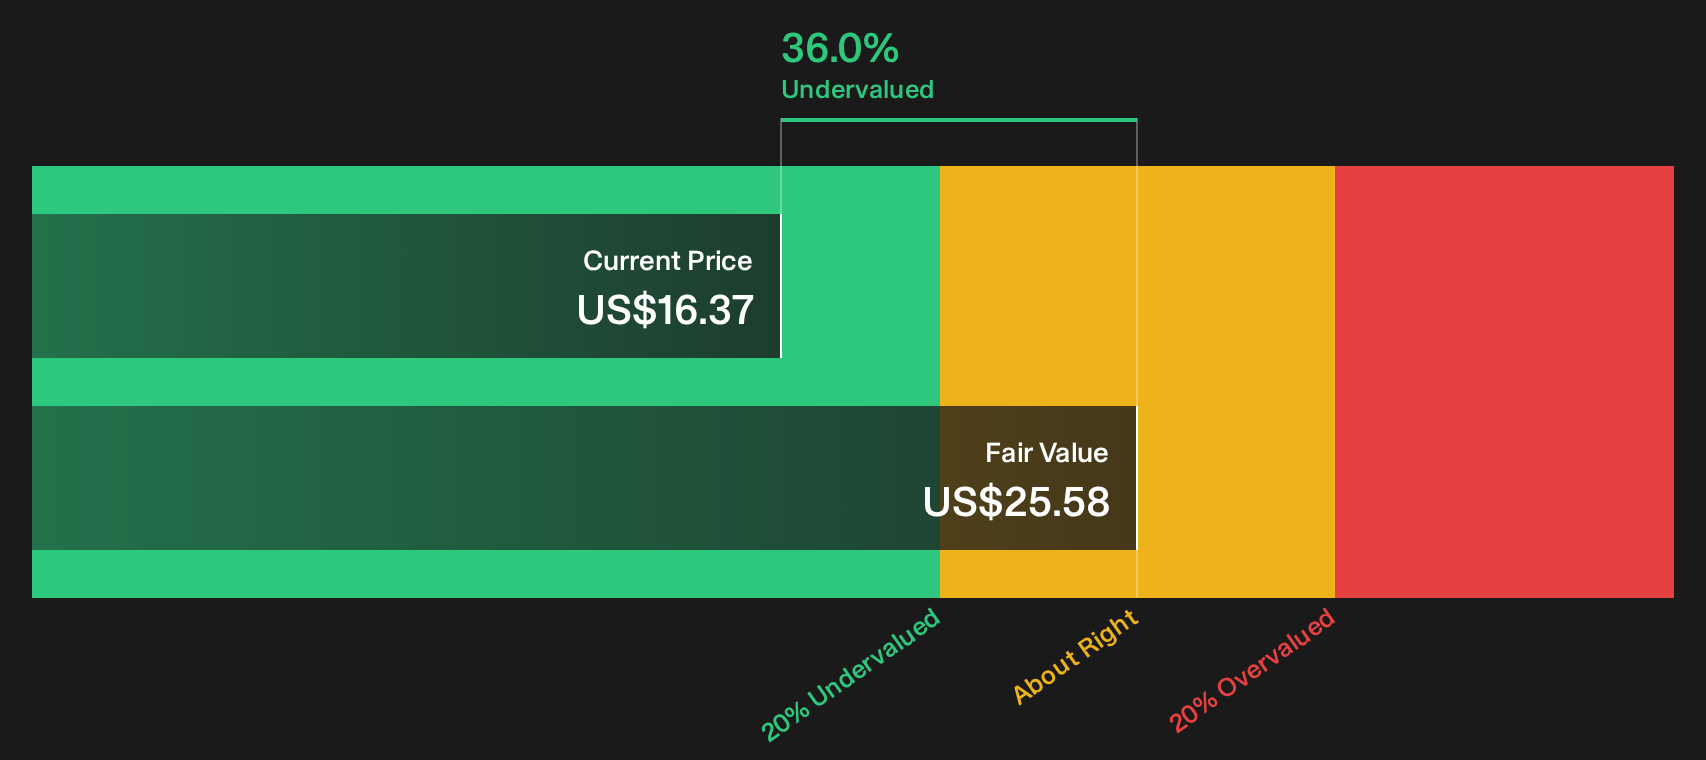
Putting these together, the Excess Returns framework arrives at an intrinsic value of about $25.84 per share, compared with the current price around $16.17. On this basis, the stock appears about 37.4% undervalued. The recent $213 million ESOP equity shelf and related dilution concerns help explain why the market price may sit below this intrinsic estimate, even with the return profile implied by the model.
On the Excess Returns view, Hercules Capital stock currently screens as undervalued relative to its estimated intrinsic value.
Our Excess Returns analysis suggests Hercules Capital is undervalued by 37.4%. Track this in your watchlist or portfolio, or discover 47 more high quality undervalued stocks.
Does Hercules Capital Look Undervalued on Earnings?
P/E is usually one of the clearest ways to compare income focused finance stocks like Hercules Capital with peers. Hercules Capital currently trades on a P/E of about 9.1x, which is well below the Capital Markets industry average of roughly 39.6x and also below the wider peer group average of about 27.6x.
On Simply Wall St’s fair multiple framework, a P/E of about 12.2x would be more in line with what you might expect for Hercules Capital given its profile. The current 9.1x therefore implies a material discount to that tailored benchmark. Even with the recent ESOP equity shelf raising dilution concerns, the P/E still prices Hercules Capital at a lower level than both its industry and this fair ratio estimate.
Overall, the stock appears undervalued on the P/E multiple compared with both peers and the model’s fair ratio for Hercules Capital.

See what the numbers say about this price — find out in our valuation breakdown.
The Hercules Capital Narrative: What Would Justify Today's Price?
Simply Wall St Narratives pick up where Hercules Capital's valuation gap leaves off by spelling out which assumptions about future growth, margins and earnings would need to hold for the stock to be worth significantly more or less than today's price on the Community page. Each scenario links a fair value to a clear storyline around Hercules Capital's potential catalysts and risks, so you can track over time which version of events appears to be playing out.
Community views on Hercules Capital sit on a wide spectrum, from a legal-risk discount story to a tech and life sciences growth story.
Bull case: 16% undervalued
"Sustained expansion in the technology and life sciences sectors continues to drive record growth in new loan originations and fundings for Hercules, supporting robust revenue and net investment income growth into 2026..."
Read the full Bull Case to see why Hercules Capital could be undervalued
Bear case: roughly fairly valued
"Hercules Capital may face pressure on future core yields, which have already declined from 12.9% in Q4 to 12.6% in Q1, due to declining base rates and spread compression, potentially impacting revenue growth and net income..."
Read the full Bear Case to see why Hercules Capital could be overvalued
Do you think there's more to the story for Hercules Capital? Head over to our Community to see what others are saying!
The Bottom Line
Hercules Capital screens as undervalued on both the Excess Returns intrinsic value work and the earnings multiple, with the broader checks lining up on the same side. That discount, however, sits against real dilution and legal overhangs that could justify a lower market price for some time. The key question from here is whether those risks ease enough for the intrinsic value and P/E views to pull the stock closer to their implied levels, or whether the current gap simply reflects a value trap that investors treat with caution.
This article by Simply Wall St is general in nature. We provide commentary based on historical data and analyst forecasts only using an unbiased methodology and our articles are not intended to be financial advice. It does not constitute a recommendation to buy or sell any stock, and does not take account of your objectives, or your financial situation. We aim to bring you long-term focused analysis driven by fundamental data. Note that our analysis may not factor in the latest price-sensitive company announcements or qualitative material. Simply Wall St has no position in any stocks mentioned.
Have feedback on this article? Concerned about the content? Get in touch with us directly. Alternatively, email editorial-team@simplywallst.com