


Recent performance puts Hubbell’s returns into context
Recent trading in Hubbell (HUBB) has drawn attention after the stock rose 1.4% over the past day but is down about 6.7% over the past month and 10.5% in the past 3 months.
See our latest analysis for Hubbell.
For context, Hubbell’s recent pullback follows a period where the 1-year total shareholder return is 14.94% and the 5-year total shareholder return is 170.31%. The share price is currently US$488.67, which suggests momentum has recently faded after a strong multi year run.
If you are looking for other grid and infrastructure ideas with different risk and growth profiles, the 33 power grid technology and infrastructure stocks is a straightforward way to spot more listed opportunities in this space.
After a multi year climb and a recent pullback, Hubbell now sits at US$488.67 with solid long term returns already on the table. Do the current risks and valuation terms still suit new buyers, or mainly existing holders?
Most Popular Narrative: 11.3% Undervalued
On the narrative view, Hubbell’s fair value of $550.77 sits above the current $488.67 share price, which puts more focus on the earnings and cash flow story behind that gap.
Continued investment in acquisitions and focus on market-leading positions in utility and electrical markets, underpinned by secular growth trends, are expected to sustain long-term revenue growth and EPS expansion.
Want to see what sits behind that confidence in Hubbell’s future cash generation? The narrative leans heavily on projected revenue momentum, margin gains and an earnings profile that supports a higher valuation multiple over time.
Result: Fair Value of $550.77 (UNDERVALUED)
Have a read of the narrative in full and understand what's behind the forecasts.
However, that narrative around Hubbell also leans on clean execution, with higher raw material and tariff costs, as well as any slowdown in grid automation sales, both being potential spoilers.
Find out about the key risks to this Hubbell narrative.
Another View: Hubbell through a cash flow lens
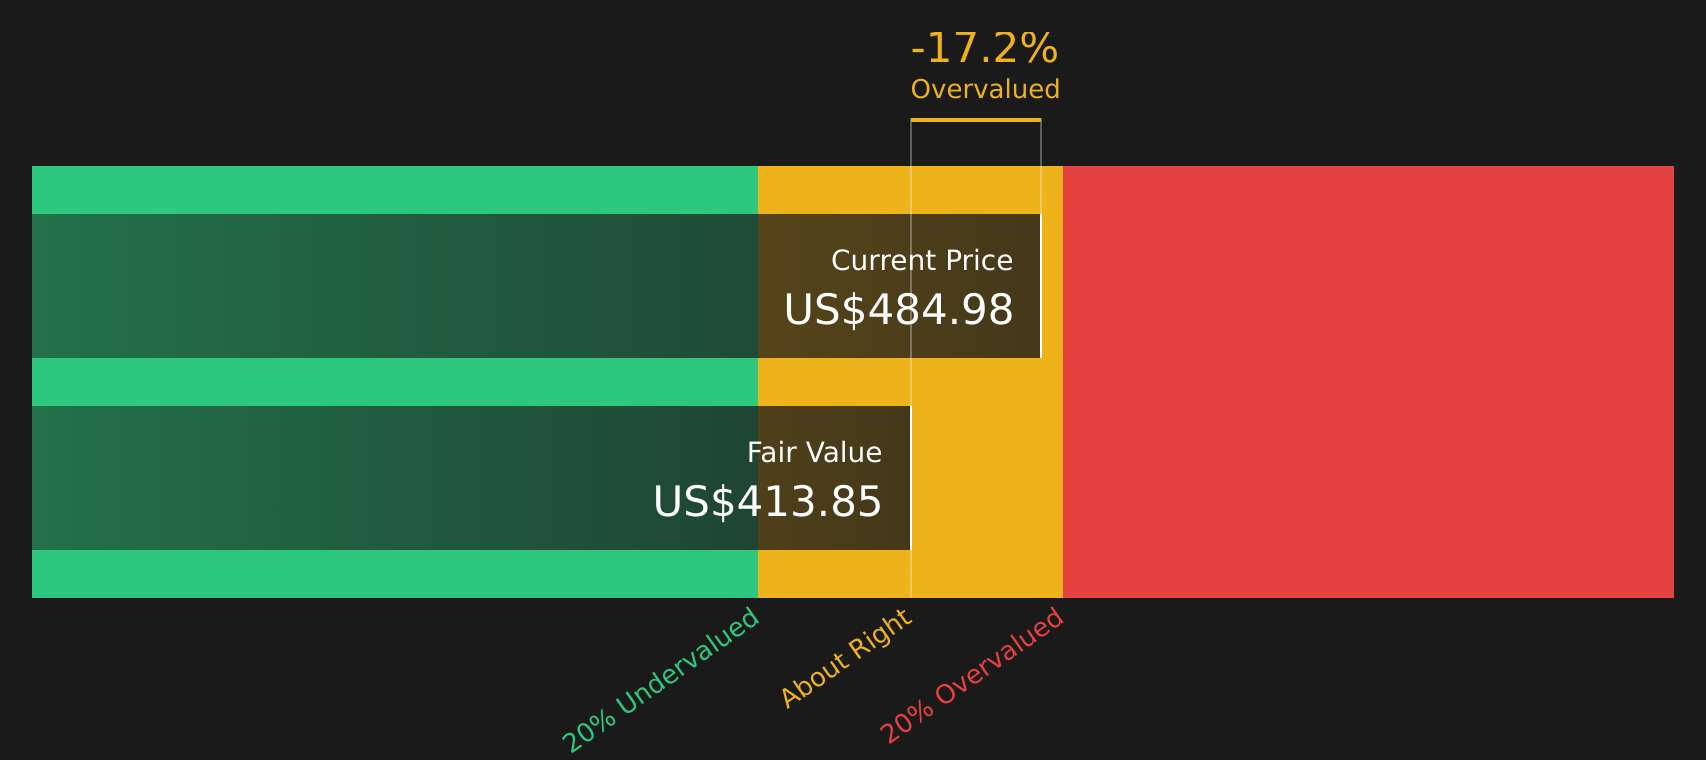
While the narrative fair value for Hubbell points to around 11.3% upside, the SWS DCF model tells a different story. On that cash flow view, Hubbell’s current US$488.67 share price sits above an estimated value of US$413.85, which frames the stock as expensive rather than undervalued.
This gap leaves you with a trade off to weigh: does the earnings narrative justify paying ahead of the DCF, or is it better to wait for a price that lines up more closely with modeled cash flows?
Look into how the SWS DCF model arrives at its fair value.
Simply Wall St performs a discounted cash flow (DCF) on every stock in the world every day (check out Hubbell for example). We show the entire calculation in full. You can track the result in your watchlist or portfolio and be alerted when this changes, or use our stock screener to discover 47 high quality undervalued stocks. If you save a screener we even alert you when new companies match - so you never miss a potential opportunity.
Next Steps
With sentiment on Hubbell split between risk flags and long term rewards, it makes sense to move quickly, review the data yourself, and weigh both sides via the 3 key rewards and 1 important warning sign.
Looking for more investment ideas beyond Hubbell?
If Hubbell has your attention, do not stop there. Use the Simply Wall Street Screener to quickly scan other stocks that might better suit your goals and risk tolerance.
- Target income potential with steady cash returns by reviewing companies we group as 8 dividend fortresses.
- Hunt for quality at a reasonable price by scanning stocks that show up in the 47 high quality undervalued stocks.
- Prioritize capital preservation by checking companies that appear in our 82 resilient stocks with low risk scores.
This article by Simply Wall St is general in nature. We provide commentary based on historical data and analyst forecasts only using an unbiased methodology and our articles are not intended to be financial advice. It does not constitute a recommendation to buy or sell any stock, and does not take account of your objectives, or your financial situation. We aim to bring you long-term focused analysis driven by fundamental data. Note that our analysis may not factor in the latest price-sensitive company announcements or qualitative material. Simply Wall St has no position in any stocks mentioned.
Have feedback on this article? Concerned about the content? Get in touch with us directly. Alternatively, email editorial-team@simplywallst.com