


In July 2026, global markets have been marked by volatility, with major indices like the Nasdaq Composite and S&P 500 Index experiencing declines due to pressures in tech and AI sectors, while small-cap stocks reflected by the Russell 2000 Index showed resilience amid broader market challenges. The easing of inflation expectations has contributed to a more favorable interest rate outlook, presenting potential opportunities for investors considering small-cap stocks that may be undervalued yet poised for growth within this shifting economic landscape.
Top 10 Undervalued Small Caps With Insider Buying Globally
| Name | PE | PS | Discount to Fair Value | Value Rating |
|---|---|---|---|---|
| Nederman Holding | 18.2x | 0.8x | 27.03% | ★★★★★☆ |
| Centurion | 11.5x | 3.9x | 34.74% | ★★★★★☆ |
| NoHo Partners Oyj | 16.4x | 0.4x | 35.62% | ★★★★★☆ |
| Natural Food International Holding | 12.1x | 1.3x | 1.92% | ★★★★☆☆ |
| Bilia | 16.0x | 0.3x | 36.45% | ★★★★☆☆ |
| Bytes Technology Group | 18.7x | 4.4x | 9.65% | ★★★★☆☆ |
| Firan Technology Group | 39.1x | 2.9x | 22.36% | ★★★★☆☆ |
| Primaris Real Estate Investment Trust | 14.1x | 4.1x | 42.64% | ★★★★☆☆ |
| Pizza Pizza Royalty | 13.9x | 10.6x | 34.03% | ★★★☆☆☆ |
| Audioboom Group | 40.7x | 1.3x | 49.31% | ★★★☆☆☆ |
Let's uncover some gems from our specialized screener.
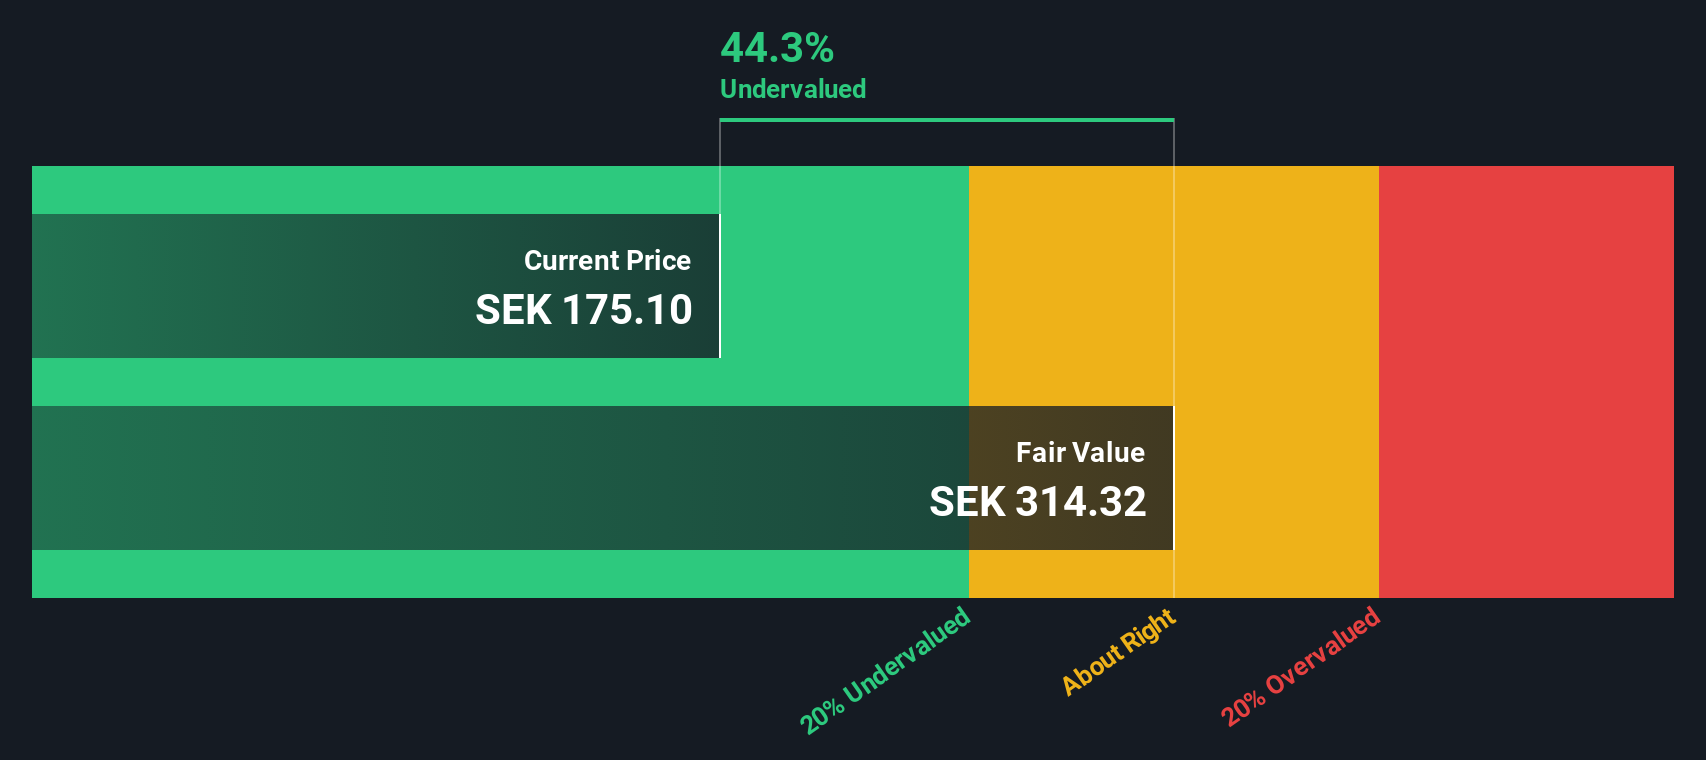
Hemnet Group (OM:HEM)
Simply Wall St Value Rating: ★★★☆☆☆
Overview: Hemnet Group operates as an internet information provider, primarily focusing on real estate listings, with a market capitalization of approximately SEK 11.30 billion.
Operations: The company generates revenue primarily from its Internet Information Providers segment, with recent figures showing SEK 1.33 billion. A significant portion of costs is attributed to COGS, which stood at SEK 211.7 million in the latest period. The gross profit margin has shown fluctuations, reaching 84.13% recently after peaking at 86.96%. Operating expenses are substantial, driven largely by general and administrative expenses amounting to SEK 510.7 million in the most recent quarter.
PE: 19.6x
Hemnet Group, a smaller company in the real estate tech sector, is navigating challenges with declining sales and revenue, reporting SEK 619.7 million for the first half of 2026 compared to SEK 813 million previously. Despite this, insider confidence is evident through executive changes and strategic initiatives like "Under-the-radar" listings aimed at enhancing market transparency. The company's share repurchase program worth SEK 600 million reflects efforts to optimize capital structure amidst high debt levels and volatile stock performance.
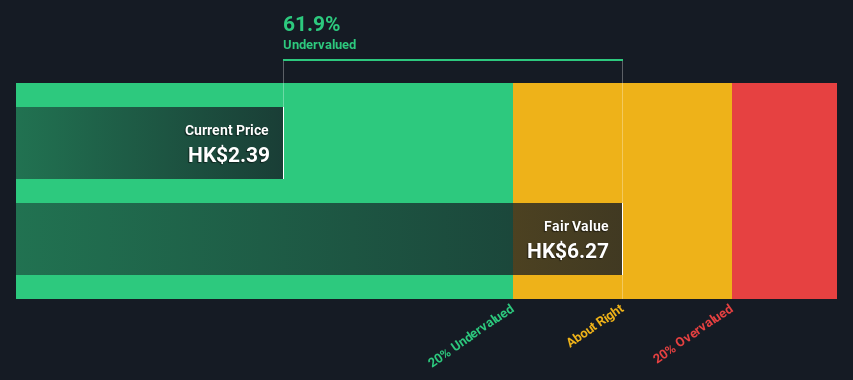
Shougang Fushan Resources Group (SEHK:639)
Simply Wall St Value Rating: ★★★★☆☆
Overview: Shougang Fushan Resources Group is engaged in the coking coal mining industry, with a market cap of HK$14.24 billion.
Operations: The company generates revenue primarily from coking coal mining, with recent figures indicating a revenue of HK$5.06 billion. The cost of goods sold (COGS) for the same period was HK$3.97 billion, resulting in a gross profit margin of 21.44%. Operating expenses were recorded at HK$342.51 million, while non-operating expenses amounted to HK$108.96 million, impacting the net income margin which stood at 12.51%.
PE: 19.3x
Shougang Fushan Resources Group, a smaller player in the market, has seen insider confidence with Wenli Fan purchasing 208,000 shares for approximately HK$451,692. This move suggests potential faith in the company's future prospects despite challenges like decreased profit margins from 29.1% to 12.5%. The company relies entirely on external borrowing for funding, which adds risk. However, earnings are projected to grow by 12.33% annually, offering a glimpse of potential growth ahead amid these financial dynamics.
Nam Cheong (SGX:1MZ)
Simply Wall St Value Rating: ★★★★☆☆
Overview: Nam Cheong is a Malaysia-based company primarily engaged in the chartering of offshore support vessels, with a market capitalization of approximately SGD 0.02 billion.
Operations: The company's revenue primarily comes from chartering, with a notable fluctuation in its net income margin over recent years. The gross profit margin has shown variability, reaching as high as 65.03% and experiencing negative figures during certain periods. Operating expenses are a significant cost factor, with general and administrative expenses consistently present in the financial structure.
PE: 4.2x
Nam Cheong's recent financial performance shows promising growth, with first-quarter sales reaching MYR 117.93 million and net income soaring to MYR 78.93 million from MYR 30.38 million a year earlier. This increase in earnings per share highlights potential value despite the company's reliance on external borrowing for funding, which carries higher risk than customer deposits. Insider confidence is evident as their CEO purchased 277,000 shares worth approximately MYR 199,301 in May, signaling potential optimism about future prospects despite forecasts of declining earnings over the next three years amidst anticipated revenue growth of around 13% annually.
- Unlock comprehensive insights into our analysis of Nam Cheong stock in this valuation report.
Gain insights into Nam Cheong's past trends and performance with our Past report.
Summing It All Up
- Investigate our full lineup of 136 Undervalued Global Small Caps With Insider Buying right here.
- Already own these companies? Bring clarity to your investment decisions by linking up your portfolio with Simply Wall St, where you can monitor all the vital signs of your stocks effortlessly.
- Simply Wall St is a revolutionary app designed for long-term stock investors, it's free and covers every market in the world.
Contemplating Other Strategies?
- Explore high-performing small cap companies that haven't yet garnered significant analyst attention.
- Fuel your portfolio with companies showing strong growth potential, backed by optimistic outlooks both from analysts and management.
- Find companies with promising cash flow potential yet trading below their fair value.
This article by Simply Wall St is general in nature. We provide commentary based on historical data and analyst forecasts only using an unbiased methodology and our articles are not intended to be financial advice. It does not constitute a recommendation to buy or sell any stock, and does not take account of your objectives, or your financial situation. We aim to bring you long-term focused analysis driven by fundamental data. Note that our analysis may not factor in the latest price-sensitive company announcements or qualitative material. Simply Wall St has no position in any stocks mentioned.
Have feedback on this article? Concerned about the content? Get in touch with us directly. Alternatively, email editorial-team@simplywallst.com