


Interparfums stock has delivered a 77.9% total return over the past five years, yet its current market price sits between two conflicting valuation signals, with a Discounted Cash Flow (DCF) estimate pointing to meaningful upside while earnings based multiples suggest the shares are not cheap.
- Over five years, Interparfums has returned 77.9%, which puts recent share performance firmly in positive territory and raises the bar for what counts as attractive value today.
- The recent update on net sales, with growth from United States operations and pressure on European sales linked to geopolitical tensions, can shape how investors see the durability of future cash flows and the risk around regional exposure.
- Interparfums scores 3 out of 6 on our valuation checks, a mixed picture that neither clearly supports a bargain nor a clear overvaluation when all methods are considered together.
The issue now is whether the 41.6% upside suggested by the Discounted Cash Flow (DCF) intrinsic value or the richer signal from market multiples will prove to be the better guide for where Interparfums should trade next.
Does Interparfums Look Undervalued on Cash Flow?
The Discounted Cash Flow (DCF) model looks at what Interparfums might generate in future cash and brings those amounts back to today.
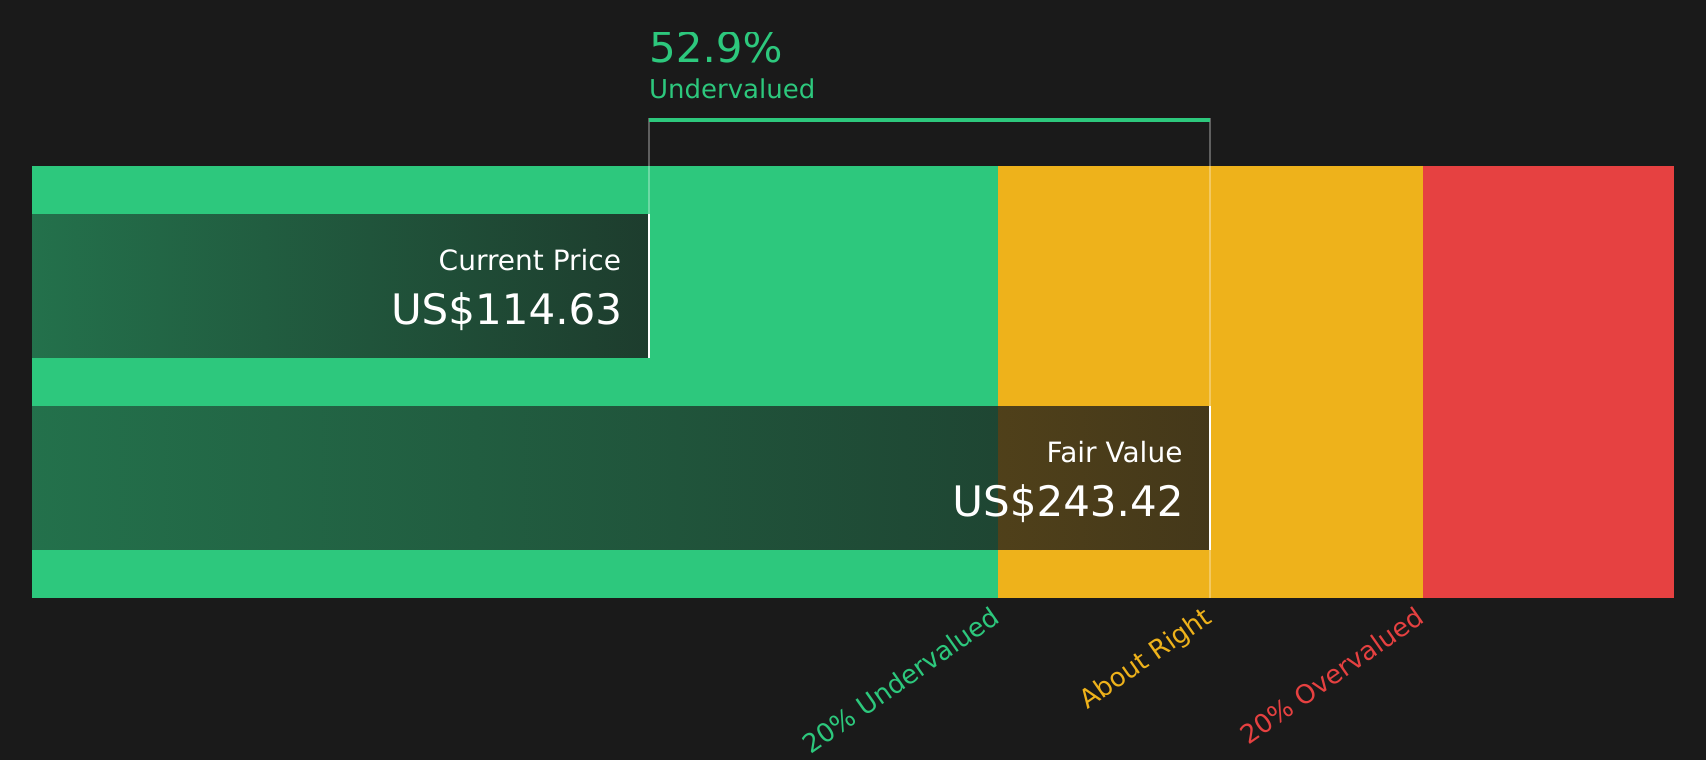
For Interparfums, the latest twelve month Free Cash Flow stands at about $179 million, and the 2 Stage Free Cash Flow to Equity model assumes that cash flows continue growing from this base over time. On those projections, the DCF points to an estimated intrinsic value of about $205 per share in dollar terms. Compared with the current share price, this implies the stock trades at roughly a 41.6% discount to that intrinsic value.
The recent update showing 2% growth in consolidated net sales, with stronger United States operations offsetting pressure on European sales, helps explain why the market may be cautious despite what the cash flow model suggests.
On balance, the Discounted Cash Flow view indicates Interparfums stock currently screens as undervalued.
Our Discounted Cash Flow (DCF) analysis suggests Interparfums is undervalued by 41.6%. Track this in your watchlist or portfolio, or discover 38 more high quality undervalued stocks.
Has Interparfums Run Too Far on Earnings?
The P/E ratio is a useful starting point for Interparfums because earnings are a key focus for established consumer brands. Interparfums currently trades on a P/E of about 22.7x, compared with an industry average of roughly 18.6x for Personal Products and a peer group average of about 49.8x. That places the stock above the broader sector but below many listed peers.
A fair P/E ratio that adjusts for Interparfums' size, margins and risk profile is estimated at around 15.1x. This is materially lower than where the stock trades today. The gap between the current 22.7x and this fair multiple suggests investors are paying a premium relative to what this framework implies, even if the valuation is not as stretched as some peers.
On this earnings multiple, Interparfums stock screens as overvalued compared with its modelled fair P/E level.

See what the numbers say about this price — find out in our valuation breakdown.
The Interparfums Narrative: What Would Justify Today's Price?
Simply Wall St Narratives pick up where this Interparfums valuation puzzle leaves off, spelling out which future paths for growth, margins and earnings would need to play out for the stock to be worth materially more or less than today's price. They sit on Simply Wall St's Community page. Rather than lean on a single multiple or model output, each narrative lays out the assumptions driving its view of fair value so you can compare them with Interparfums' results as they are reported.
One of the top community narratives on Interparfums: 10% overvalued
"Heavy dependence on licensed brands, changing consumer preferences, currency risks, retailer destocking, and rising competition threaten profitability, revenue stability, and brand strength..."
Read one of the top narratives on Interparfums
Do you think there's more to the story for Interparfums? Head over to our Community to see what others are saying!
The Bottom Line
For Interparfums, the Discounted Cash Flow (DCF) intrinsic value estimate points to a sizeable valuation gap, while the P/E based view suggests the stock already trades at a premium to its tailored fair multiple. That split comes down to what investors prioritise: the timing and durability of cash flows on one side, or current earnings, sentiment and where peers are priced on the other.
With overall valuation checks landing in mixed territory, the key question from here is whether Interparfums can sustain cash generation and margins in the face of regional and brand concentration risks, or whether today’s earnings multiple already bakes those strengths in.
This article by Simply Wall St is general in nature. We provide commentary based on historical data and analyst forecasts only using an unbiased methodology and our articles are not intended to be financial advice. It does not constitute a recommendation to buy or sell any stock, and does not take account of your objectives, or your financial situation. We aim to bring you long-term focused analysis driven by fundamental data. Note that our analysis may not factor in the latest price-sensitive company announcements or qualitative material. Simply Wall St has no position in any stocks mentioned.
Have feedback on this article? Concerned about the content? Get in touch with us directly. Alternatively, email editorial-team@simplywallst.com