


Over the last 7 days, the United States market has dropped 2.0%, yet it remains up by 15% over the past year with earnings forecast to grow by 17% annually. In such a fluctuating environment, identifying stocks that are estimated to be significantly below their intrinsic value can offer potential opportunities for investors seeking undervalued assets.
Top 10 Undervalued Stocks Based On Cash Flows In The United States
| Name | Current Price | Fair Value (Est) | Discount (Est) |
| York Space Systems (YSS) | $17.62 | $33.87 | 48% |
| VSE (VSEC) | $197.35 | $382.78 | 48.4% |
| Symbotic (SYM) | $40.57 | $80.65 | 49.7% |
| Q2 Holdings (QTWO) | $52.88 | $102.35 | 48.3% |
| Omada Health (OMDA) | $21.20 | $40.88 | 48.1% |
| Live Oak Bancshares (LOB) | $42.65 | $82.10 | 48% |
| Lazard (LAZ) | $43.05 | $83.69 | 48.6% |
| Boeing (BA) | $209.23 | $413.20 | 49.4% |
| Beacon Financial (BBT) | $29.99 | $59.51 | 49.6% |
| Alkami Technology (ALKT) | $16.28 | $31.90 | 49% |
Let's explore several standout options from the results in the screener.
Bloom Energy (BE)
Overview: Bloom Energy Corporation designs, manufactures, sells, and installs solid oxide fuel cell systems for on-site power generation both in the United States and internationally, with a market cap of $62.07 billion.
Operations: The company's revenue is primarily derived from its electric equipment segment, totaling $2.45 billion.
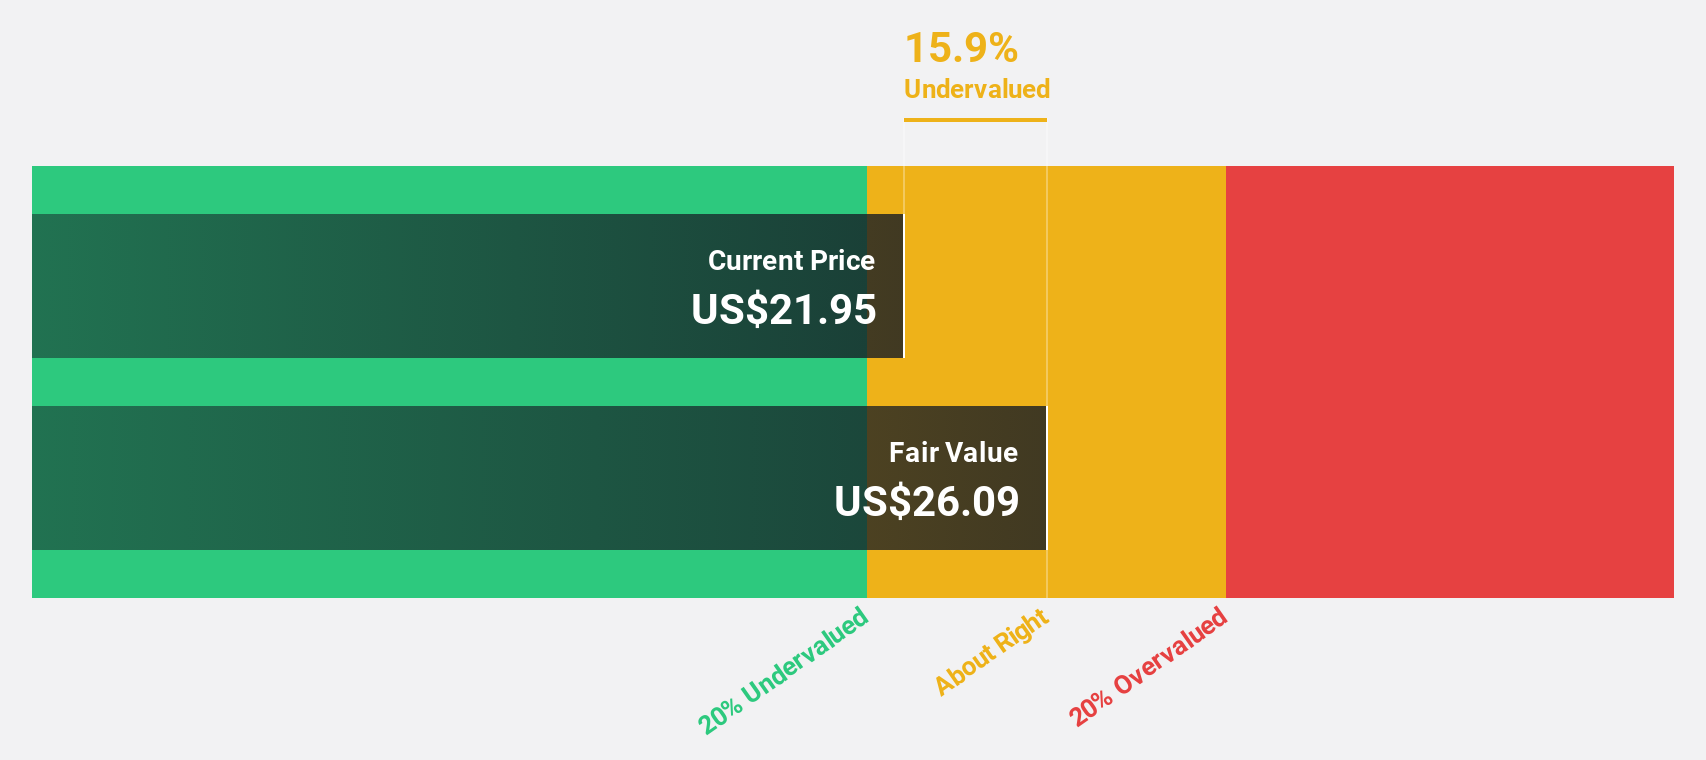
Estimated Discount To Fair Value: 41.1%
Bloom Energy's recent strategic partnerships, such as the expanded collaboration with Brookfield and agreements with Nebius and Oracle, highlight its growing role in powering AI infrastructure. Despite being dropped from several indices, its addition to the Russell 1000 Growth Benchmark reflects positive market sentiment. The stock trades at US$217.3, significantly below its estimated future cash flow value of US$369.18, suggesting it is undervalued based on cash flows. Earnings are forecasted to grow substantially over the next few years.
- Our growth report here indicates Bloom Energy may be poised for an improving outlook.
- Get an in-depth perspective on Bloom Energy's balance sheet by reading our health report here.
Ciena (CIEN)
Overview: Ciena Corporation is a network technology company that offers hardware, software, and services to network operators worldwide, with a market cap of approximately $56.22 billion.
Operations: Ciena's revenue segments include Networking Platforms at $4.41 billion, Global Services at $681.05 million, Platform Software and Services at $370.58 million, and Blue Planet Automation Software and Services at $105.35 million.
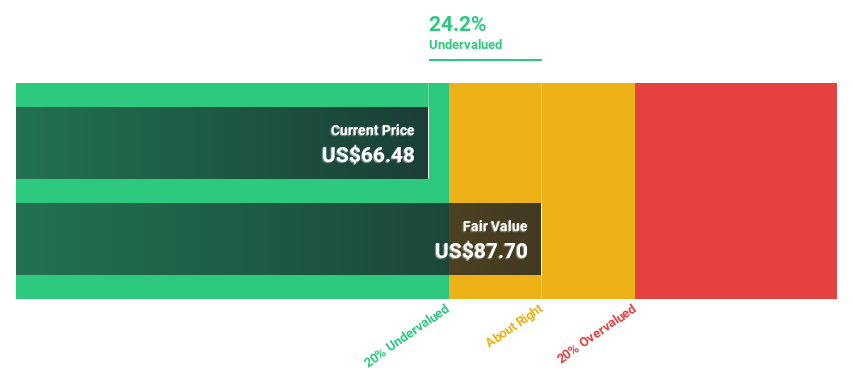
Estimated Discount To Fair Value: 38%
Ciena's addition to the Russell 1000 Growth Benchmark aligns with its strong financial performance, including a significant earnings increase. The stock is trading at US$407.53, considerably below its estimated future cash flow value of US$657.28, highlighting potential undervaluation based on cash flows. Recent strategic initiatives in AI and quantum-safe technologies further bolster its growth prospects, with expected earnings growth surpassing market averages over the next few years.
- According our earnings growth report, there's an indication that Ciena might be ready to expand.
- Dive into the specifics of Ciena here with our thorough financial health report.
Vertiv Holdings Co (VRT)
Overview: Vertiv Holdings Co specializes in designing, manufacturing, and servicing essential digital infrastructure technologies and life cycle services for data centers, communication networks, and commercial and industrial environments globally with a market cap of $115.68 billion.
Operations: The company's revenue segments are comprised of $7.05 billion from the Americas, $2.42 billion from the Asia Pacific, and $2.35 billion from Europe, the Middle East, and Africa.
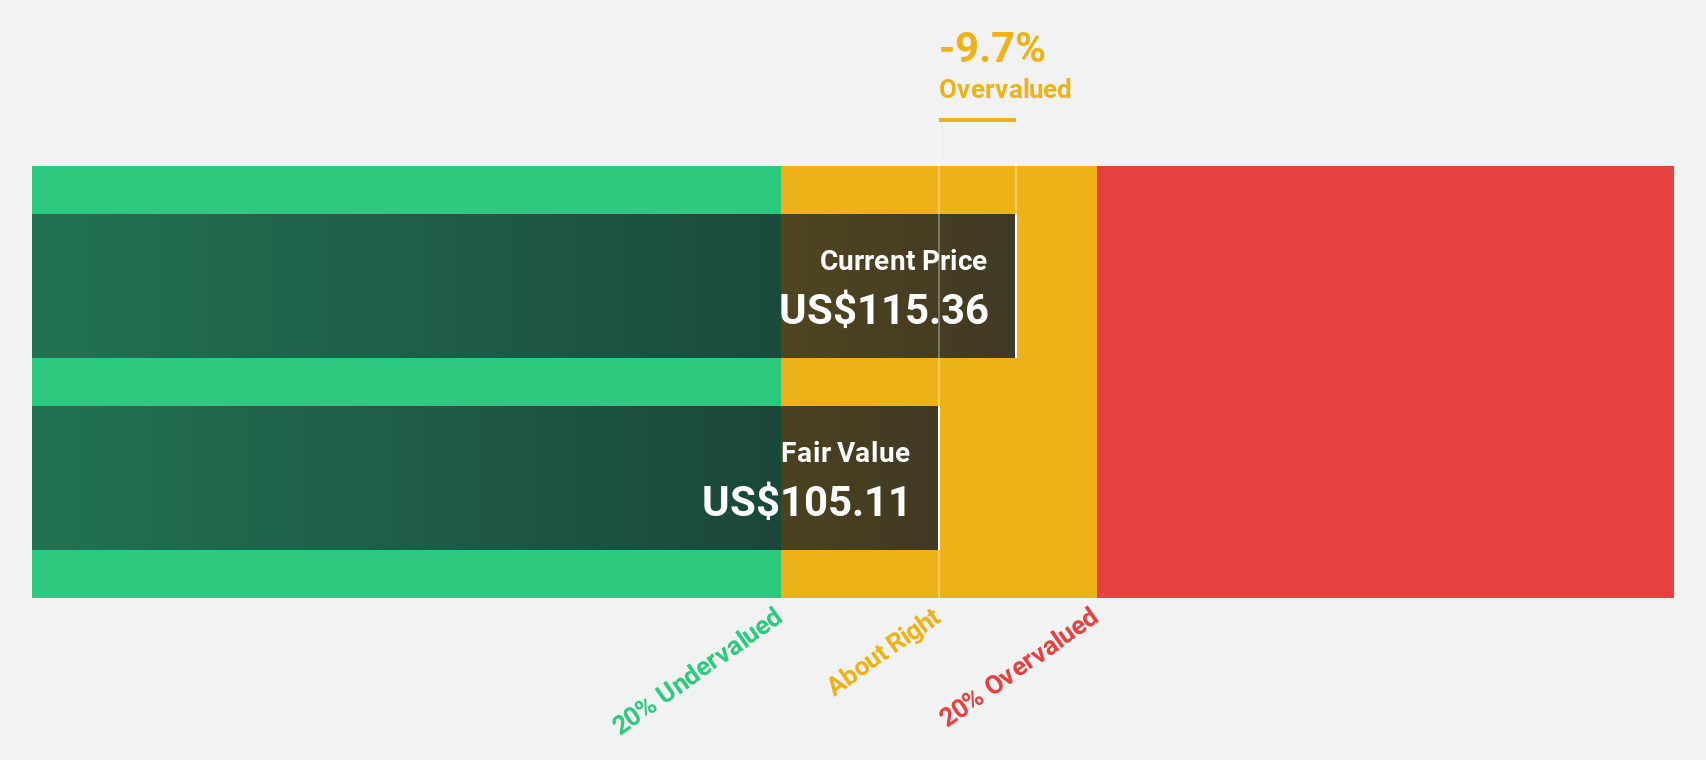
Estimated Discount To Fair Value: 14.6%
Vertiv Holdings Co's stock is trading at US$304.04, below its estimated future cash flow value of US$356.11, suggesting potential undervaluation based on cash flows. Recent expansion in Malaysia aims to support demand for AI and high-density computing infrastructure, enhancing regional capabilities. Despite being dropped from some indices, its inclusion in the Russell Top 200 reflects growth potential with expected earnings growth of 25.1% annually, outpacing the broader US market's forecasted earnings growth.
- Upon reviewing our latest growth report, Vertiv Holdings Co's projected financial performance appears quite optimistic.
- Click here to discover the nuances of Vertiv Holdings Co with our detailed financial health report.
Key Takeaways
- Click here to access our complete index of 137 Undervalued US Stocks Based On Cash Flows.
- Have you diversified into these companies? Leverage the power of Simply Wall St's portfolio to keep a close eye on market movements affecting your investments.
- Join a community of smart investors by using Simply Wall St. It's free and delivers expert-level analysis on worldwide markets.
Looking For Alternative Opportunities?
- Explore high-performing small cap companies that haven't yet garnered significant analyst attention.
- Diversify your portfolio with solid dividend payers offering reliable income streams to weather potential market turbulence.
- Fuel your portfolio with companies showing strong growth potential, backed by optimistic outlooks both from analysts and management.
This article by Simply Wall St is general in nature. We provide commentary based on historical data and analyst forecasts only using an unbiased methodology and our articles are not intended to be financial advice. It does not constitute a recommendation to buy or sell any stock, and does not take account of your objectives, or your financial situation. We aim to bring you long-term focused analysis driven by fundamental data. Note that our analysis may not factor in the latest price-sensitive company announcements or qualitative material. Simply Wall St has no position in any stocks mentioned.
Have feedback on this article? Concerned about the content? Get in touch with us directly. Alternatively, email editorial-team@simplywallst.com