


ZTO Express (Cayman) has delivered a 22.4% share price return over the past year, yet its valuation checks and intrinsic value estimate still point to the stock trading at a discount to what its cash flows may justify.
- Over the last 12 months, ZTO Express (Cayman) shares are up 22.4%, which puts recent momentum on the side of existing holders.
- The company’s ability to convert parcel volumes into steady cash flow can support the current valuation, while any sustained pressure on delivery margins or higher capital needs may weigh on what investors are willing to pay.
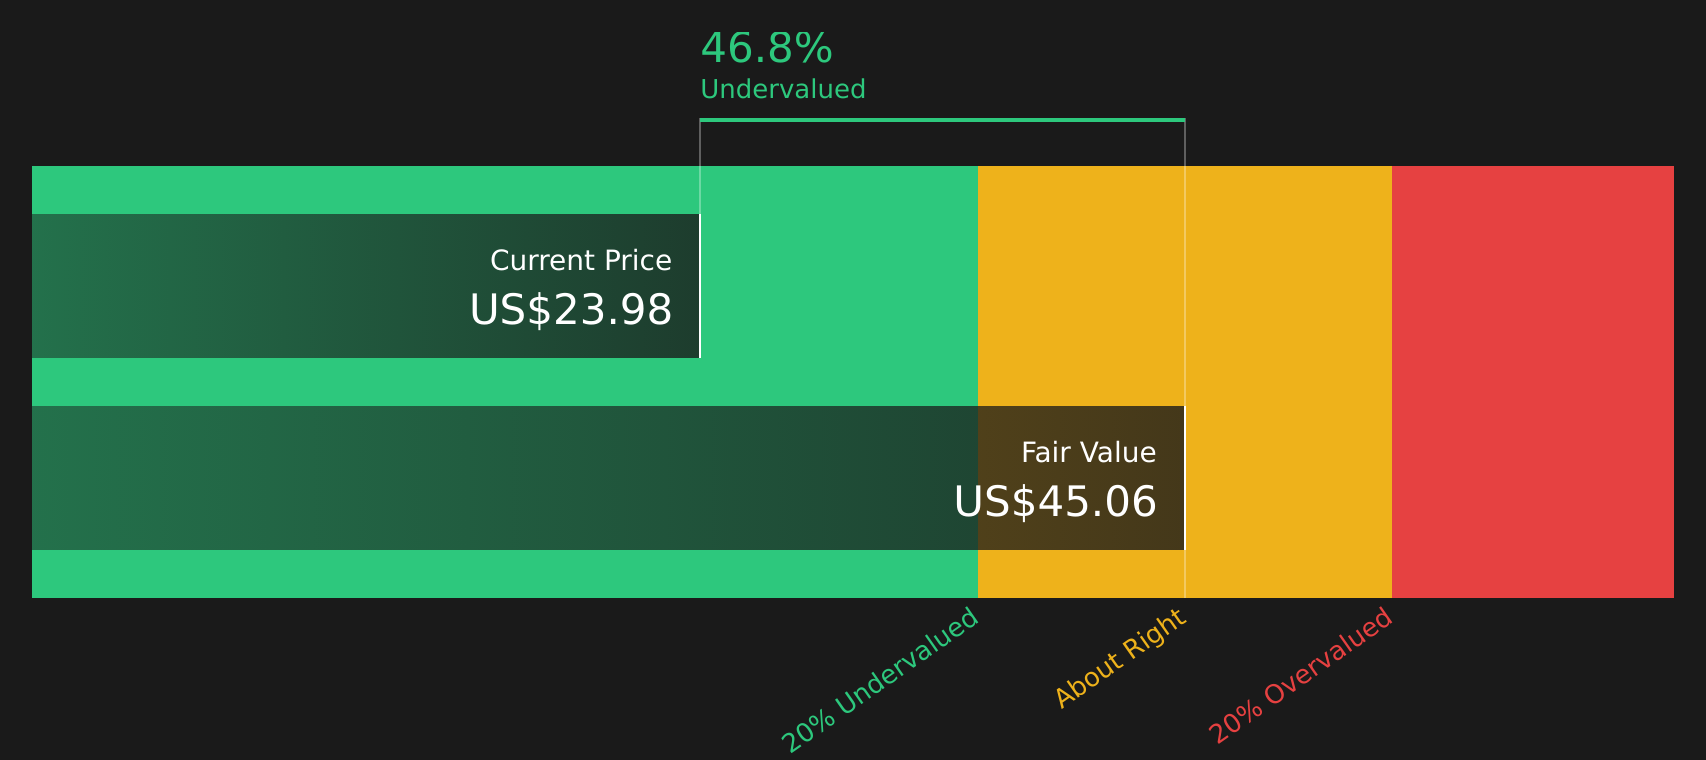
- ZTO Express (Cayman) screens as undervalued on the broader checks, with a high valuation score of 6 out of 6, and the Discounted Cash Flow (DCF) intrinsic value estimate also indicates the shares trade at a discount of about 46.6% to that model.
The issue now is whether that combination of recent gains and a still sizable valuation gap leaves ZTO Express (Cayman) offering enough compensation for the risks in its business.
Find out why ZTO Express (Cayman)'s 22.4% return over the last year is lagging behind its peers.
Does ZTO Express (Cayman) Look Undervalued on Cash Flow?
The Discounted Cash Flow (DCF) model focuses on what ZTO Express (Cayman) could generate in free cash over time and discounts that back to today. Based on the latest twelve-month figures, the company produced about CN¥5.3b of free cash flow, and the model assumes that free cash flow grows from this base rather than shrinking, consistent with the 2 Stage Free Cash Flow to Equity approach used.
Under these assumptions, the DCF model points to an estimated intrinsic value of about $45 per share. Compared with the current share price, that implies the stock trades at roughly a 46.6% discount to this intrinsic value estimate, which indicates the market is attaching a more cautious view to ZTO Express (Cayman) than the cash flow projections suggest.
Overall, the Discounted Cash Flow (DCF) analysis indicates that ZTO Express (Cayman) appears undervalued relative to its projected cash generation under these assumptions.
Our Discounted Cash Flow (DCF) analysis suggests ZTO Express (Cayman) is undervalued by 46.6%. Track this in your watchlist or portfolio, or discover 38 more high quality undervalued stocks.
Is ZTO Express (Cayman) a Bargain on Earnings?
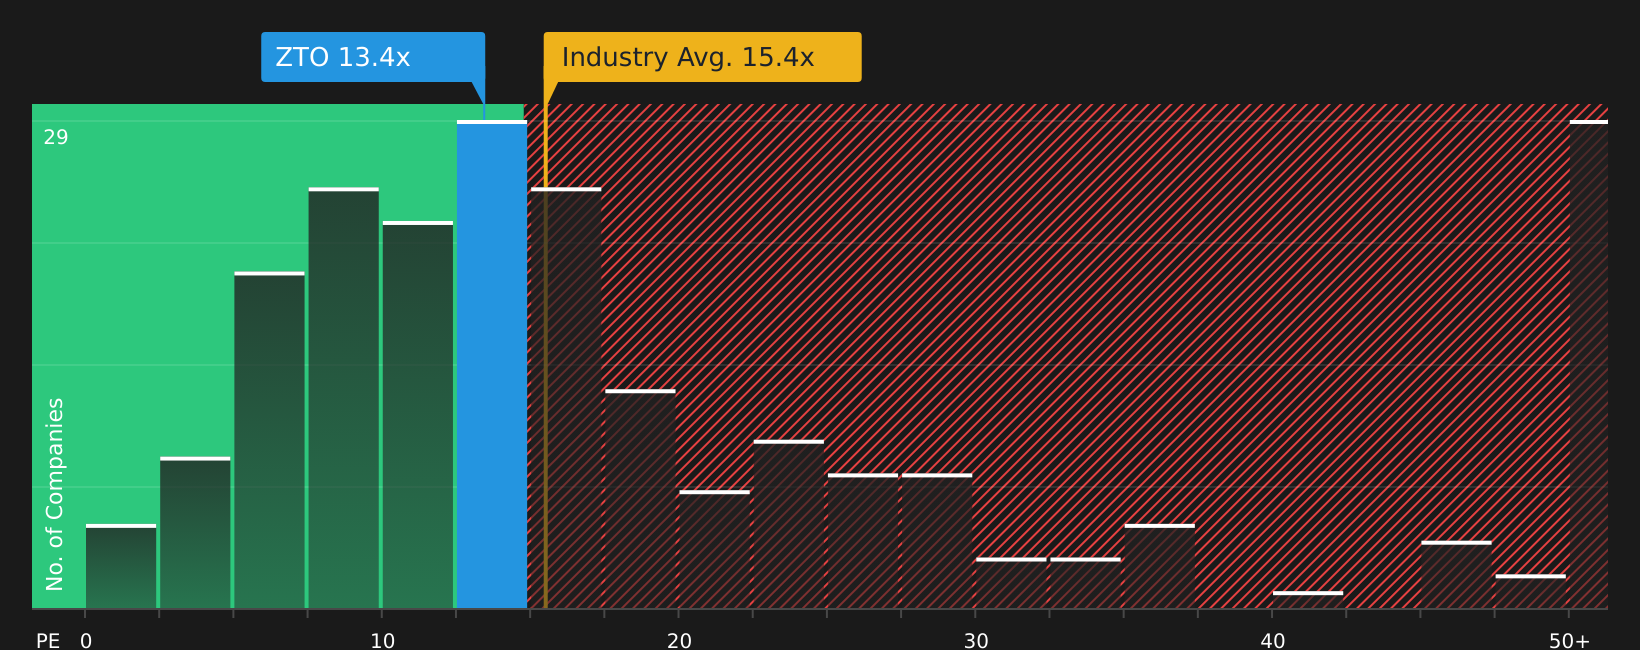
The P/E ratio suits ZTO Express (Cayman) because earnings are a key yardstick for parcel delivery businesses that generate recurring income from large shipment volumes. ZTO Express (Cayman) currently trades on a P/E of about 13.4x, which is below the logistics industry average of roughly 15.5x and well below the peer group average of around 32.7x.
A tailored fair P/E ratio for ZTO Express (Cayman), which considers its size, margins, industry profile and risk, is estimated at about 22.6x. That is materially higher than the current 13.4x multiple, suggesting the market is pricing the stock more cautiously than this framework implies. For investors who put weight on earnings based valuation checks, this gap points to a more pessimistic market view than the fair ratio model indicates.
On the P/E multiple, ZTO Express (Cayman) stock appears undervalued relative to what the fair ratio model suggests investors might typically pay for its earnings.
See what the numbers say about this price — find out in our valuation breakdown.
The ZTO Express (Cayman) Narrative: What Would Justify Today's Price?
Simply Wall St Narratives for ZTO Express (Cayman) pick up where the valuation checks leave off by spelling out which paths for growth, margins and earnings would make the stock worth materially more or less than today’s price. Each narrative links its number to a clear view of how ZTO Express (Cayman)'s growth, profitability and risks might evolve, giving you something concrete to return to as fresh results and data come through.
One of the top community narratives on ZTO Express (Cayman): 17% undervalued
"Cost saving initiatives around automation, digitization, and AI are being rapidly deployed and already yielding measurable reductions in unit costs…"
Read one of the top narratives on ZTO Express (Cayman)
Do you think there's more to the story for ZTO Express (Cayman)? Head over to our Community to see what others are saying!
The Bottom Line
ZTO Express (Cayman) still screens as undervalued, with the Discounted Cash Flow (DCF) intrinsic value estimate and the P/E based fair ratio both pointing to a gap between the share price and what its cash flows and earnings might justify. With those frameworks broadly agreeing, the key question is whether ZTO Express (Cayman) can keep translating parcel volumes into cash while protecting delivery margins and capital discipline. The crux of the bull versus bear debate is whether that discount reflects an opportunity or a fair price for the execution and industry risks already on the table.
This article by Simply Wall St is general in nature. We provide commentary based on historical data and analyst forecasts only using an unbiased methodology and our articles are not intended to be financial advice. It does not constitute a recommendation to buy or sell any stock, and does not take account of your objectives, or your financial situation. We aim to bring you long-term focused analysis driven by fundamental data. Note that our analysis may not factor in the latest price-sensitive company announcements or qualitative material. Simply Wall St has no position in any stocks mentioned.
Have feedback on this article? Concerned about the content? Get in touch with us directly. Alternatively, email editorial-team@simplywallst.com