


MYR Group (MYRG) stock has drawn attention after a recent pullback, with the share price down 7% over the past day and 19% over the past month despite strong longer term returns.
See our latest analysis for MYR Group.
The recent 1 month share price return of down 19.3% has cooled MYR Group’s strong year to date share price return of 67.2%, even as the 1 year total shareholder return stands at 89.3%. This hints that sentiment has shifted quickly after a strong run.
If you are looking for other power grid and electrification related ideas, this is a good moment to broaden your watchlist with the 35 power grid technology and infrastructure stocks
Bulls point to MYR Group’s long record of returns and grid exposure, while bears see a stock that has run hard and just slipped almost 20%. Which side does today’s valuation evidence lean toward next?
Most Popular Narrative: 17% Undervalued
On the latest close, MYR Group shares at $379.17 sit below the most widely followed fair value estimate of $455, which anchors a detailed long term narrative on growth, margins and contracts.
Significant multi-year utility contracts (notably the new 5 year master service agreement with Xcel Energy and others in the Northeast/Midwest) are set to expand recurring revenues and improve backlog visibility, supporting higher future revenue and greater earnings predictability.
Want to see what sits behind that confidence in MYR Group's backlog? The core narrative leans on rising earnings, expanding margins and a future profit multiple that assumes continued execution. Curious which specific growth and profitability assumptions underpin that $455 fair value and how they map to analyst forecasts for the next several years?
Result: Fair Value of $455 (UNDERVALUED)
Have a read of the narrative in full and understand what's behind the forecasts.
However, MYR Group’s story could change quickly if labor cost inflation pressures margins or if variability in the commercial and industrial backlog leads to less predictable revenue visibility.
Find out about the key risks to this MYR Group narrative.
Another View: What MYR Group’s P/E Ratio Is Telling You
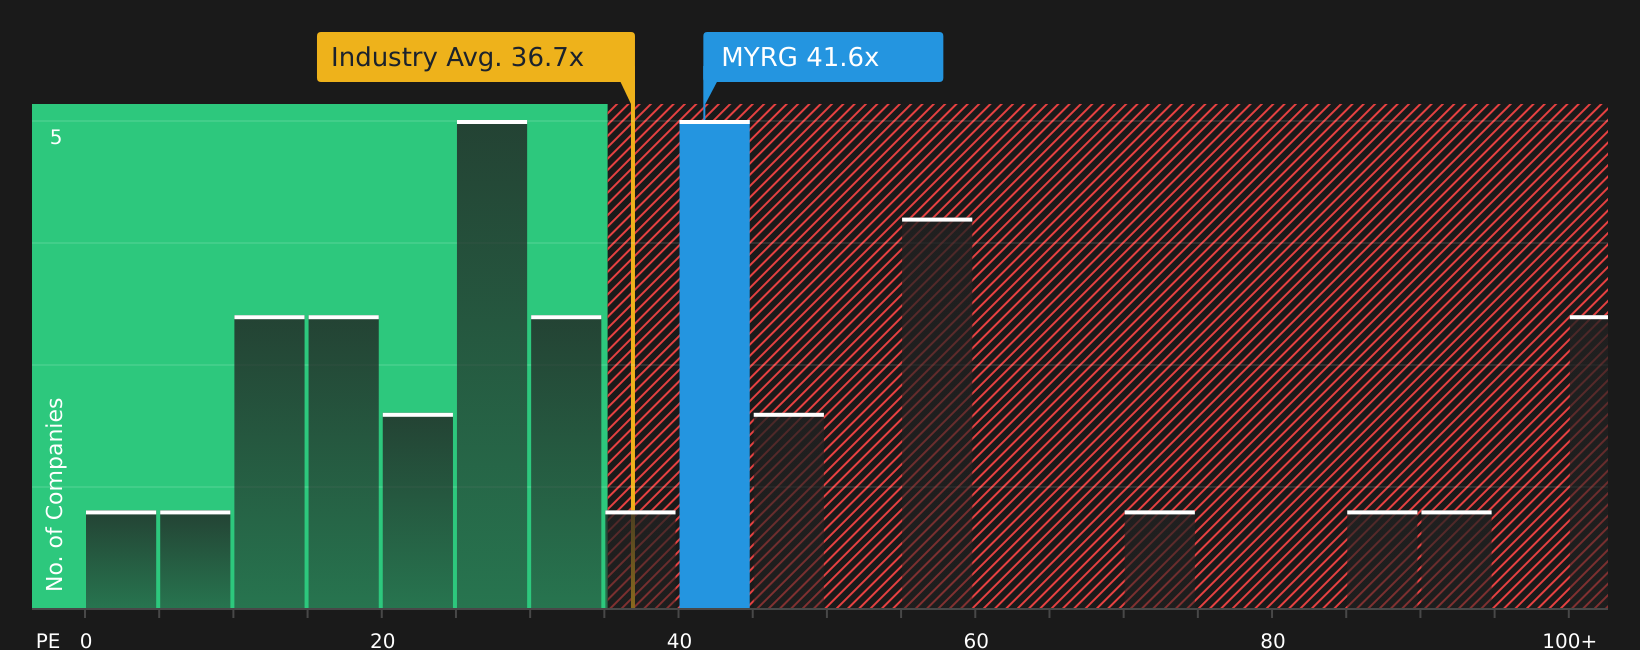
While the MYR Group narrative points to a fair value of $455 and suggests the stock is 17% undervalued, the current P/E of 41.6x paints a different picture. That is higher than both the peer average of 27.3x and a fair ratio of 32.5x, which signals meaningful valuation risk if expectations cool.
If you prefer to anchor your view on these earnings multiples rather than long term narratives, it is worth stress testing what would need to change in MYR Group’s growth or margins for the market P/E to move closer to that 32.5x fair ratio, and how comfortable you are with that gap.
See what the numbers say about this price — find out in our valuation breakdown.
Next Steps
If the mix of optimism and concern around MYR Group feels finely balanced, treat this as your cue to move quickly. Review the latest figures and weigh both sides of the story by checking the 2 key rewards and 1 important warning sign
Looking for more investment ideas beyond MYR Group?
Do not stop with just one stock story; use this moment to widen your watchlist with clear, focused ideas that match how you like to invest.
- Target resilient cash generators and let the solid balance sheet and fundamentals stocks screener (49 results) point you toward companies with fundamentals that can better support future shocks.
- Hunt for potential mispricings by scanning the 49 high quality undervalued stocks and see which stocks the market might be overlooking right now.
- Lock in income-focused ideas through the 9 dividend fortresses so you are not the one hearing about reliable high yield opportunities after they have moved.
This article by Simply Wall St is general in nature. We provide commentary based on historical data and analyst forecasts only using an unbiased methodology and our articles are not intended to be financial advice. It does not constitute a recommendation to buy or sell any stock, and does not take account of your objectives, or your financial situation. We aim to bring you long-term focused analysis driven by fundamental data. Note that our analysis may not factor in the latest price-sensitive company announcements or qualitative material. Simply Wall St has no position in any stocks mentioned.
Have feedback on this article? Concerned about the content? Get in touch with us directly. Alternatively, email editorial-team@simplywallst.com