


Forget the Panic Index (VIX), which remains at 18. US stocks are experiencing sharp fluctuations beyond the normal range of a bull market.
The Zhitong Finance App notes that in recent weeks, the broader S&P 500 index appeared to be stable, as individual fluctuations in its constituent stocks — no matter how large — largely offset each other. But at the sector level, the situation is quite different; capital is shifting from one industry to the next at lightning speed.
According to data compiled by the Sevens Report, up to now in 2026, the weekly earnings gap between the best and worst performing sectors in the S&P 500 index has reached a double-digit percentage eight times. And in this century, only 2000, 2001, and 2009 had similar situations in the same time period — these were all extremely disgraceful periods in US stock history.
Taylor Rich, a technical analyst at Sevens Report, said, “Such a huge divergence in the weekly performance of the sector should be viewed as a quantifiable warning sign of the market.” The period with similar conditions in the past “was accompanied by increased overall market volatility and signs that a continuous market top has begun to form.”
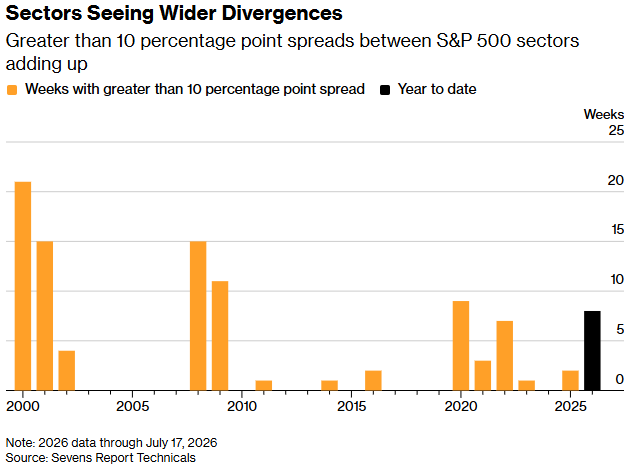
Diversification of various industries intensifies
The sharp turmoil beneath the calm surface of the S&P 500 has sounded the alarm within BTIG LLC and Sevens Report. They believe that the current trend is not so much a healthy sector rotation as a sign that the market is about to pull back.
Jonathan Klinsky, chief market technical analyst at BTIG LLC, said, “I would define sector rotation as being fundamentally-driven — that is, people have a fundamental reason to sell one type of stock and buy another — this is completely different from closing a position and closing a position.” The fluctuating performance of the market in recent weeks “is more like a type of liquidation rather than rotation.”
In a report last week, Klinsky wrote that US stocks are moving towards a record number of days this year, that is, the trend of the S&P 500 index is moving in one direction, but the indicator that measures the breadth of the market (more rising stocks than falling stocks) is moving in the opposite direction.
Since the end of May, 4 of the 8 cases where there was a double-digit weekly gap between the best and worst performing sectors in the S&P 500 index occurred during this period. Since then, the overall market performance has been relatively calm as investors evaluate conflicting news about the Iran war, the prospects for AI transactions, and the latest quarterly earnings report.
The next few days are likely to usher in a new round of sharp interindustry fluctuations, as traders prepare for the second interest rate decision made by Federal Reserve Chairman Walsh on Wednesday and the busiest week of the second-quarter earnings season. Big tech stocks, including Microsoft, Meta, and Apple, will all report earnings between Wednesday and Thursday.
In fact, a measure of the dispersion of US stocks over the next 30 days, tracked by the Chicago Options Exchange Global Markets Company, hit a record high in early July, surpassing the record set during the market turmoil caused by US President Trump's introduction of comprehensive global tariffs in April 2025.
For Rich, this turbulence is a symptom of the market “beginning to question the core narrative that has driven the rise in US stocks over the past three and a half years.”
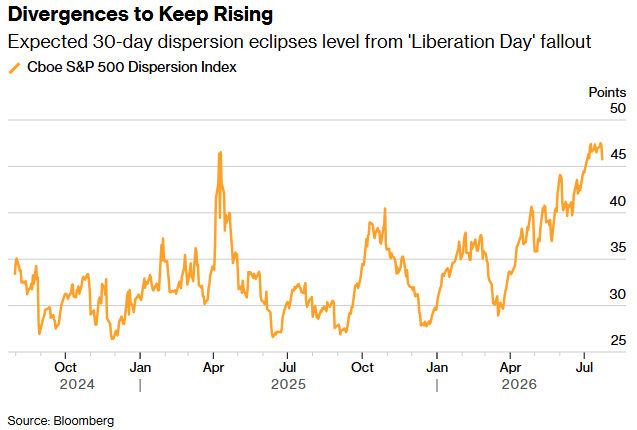
The differences continue to widen
Admittedly, others on Wall Street still see the current market pattern as a kind of rotation. J.P. Morgan's trading team encouraged traders to do the momentum factor in a “more relaxed macro environment,” adding that the recent sell-off seemed more like a kind of “rotation rather than risk taking risks.”
However, according to Klinsky, when stock correlation is close to historical lows and the general market as a whole is close to historical highs, this pattern is becoming somewhat worrying. Earlier this month, an indicator measuring the expected three-month correlation between stocks was at 0.08, a record low.
“When the correlation drops to such a low level, they only move in one direction,” he said. In this case, he is concerned that correlation will rise due to a general decline in stocks.