


Stronger Q2 earnings and higher dividend put 1st Source in focus
1st Source (SRCE) is back on investor radars after reporting higher year-over-year net interest income and net income for the second quarter of 2026, along with an increased quarterly cash dividend.
See our latest analysis for 1st Source.
The earnings beat and higher dividend come after a strong run in 1st Source’s share price, with a 16.68% 90-day share price return and a 38.95% year-to-date share price return. The 5-year total shareholder return of 118.74% reflects those gains over that period.
If this kind of sustained performance has you looking for more potential ideas, it could be worth scanning for other banks and financials with improving earnings trends via 18 top founder-led companies
After a strong move in 1st Source’s share price and a richer dividend, the question now is whether most of the easy upside is already reflected or if the current valuation still leaves meaningful room ahead.
Preferred P/E of 12.3x for 1st Source: Is it justified?
Based on the latest data, 1st Source trades on a P/E of 12.3x, which prices the stock above the US banks industry average while still below a selected peer group.
The P/E ratio compares the current share price with earnings per share. For banks like 1st Source, it gives a quick sense of how much investors are paying for each dollar of current earnings. This can reflect expectations around growth, risk, and profitability.
Here, the 12.3x P/E is described as expensive compared with the wider US banks industry average of 11.9x. It is also flagged as higher than an estimated fair P/E of 11.2x, which indicates the current market valuation sits above a level that some models suggest the stock could move toward over time. At the same time, that same 12.3x P/E is described as good value against a peer average of 23.6x, which shows that investors are paying far less for each dollar of earnings than for some comparable companies.
Adding another angle, 1st Source is also assessed as trading at a 33.1% discount to an internal fair value estimate based on future cash flows, with the SWS DCF model indicating a fair value of $129.79 against the current share price of $86.79. That mix of signals, a P/E that is a little rich versus the sector but cheaper than peers and below a modelled DCF value, underlines how different valuation tools can tell different parts of the story for the same stock.
Explore the SWS fair ratio for 1st Source
Result: Price-to-earnings of 12.3x (ABOUT RIGHT)
However, investors in 1st Source still need to watch for any pressure on US banking margins and credit quality that could challenge current earnings and valuation assumptions.
Find out about the key risks to this 1st Source narrative.
Another View on 1st Source’s Valuation
While the 12.3x P/E for 1st Source looks slightly expensive compared with an 11.9x industry average and an 11.2x fair ratio, the SWS DCF model tells a different story. On that view, 1st Source trades at a 33.1% discount to an estimated fair value of $129.79, which raises the question of which signal matters more for you.
Look into how the SWS DCF model arrives at its fair value.
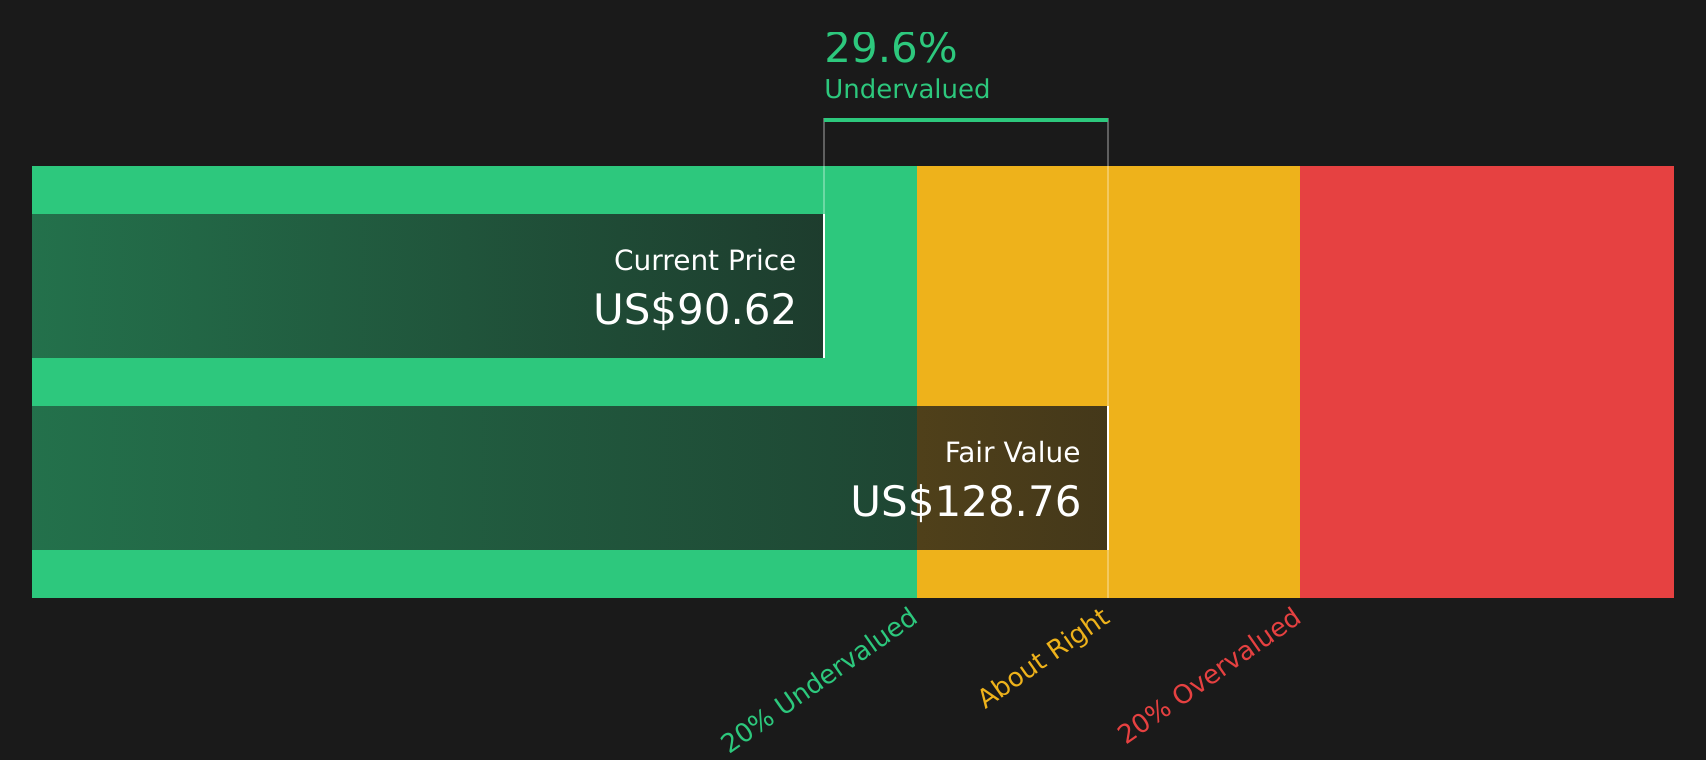
Simply Wall St performs a discounted cash flow (DCF) on every stock in the world every day (check out 1st Source for example). We show the entire calculation in full. You can track the result in your watchlist or portfolio and be alerted when this changes, or use our stock screener to discover 51 high quality undervalued stocks. If you save a screener we even alert you when new companies match - so you never miss a potential opportunity.
Next Steps
If the combination of stronger Q2 earnings, valuation signals and dividend support around 1st Source leaves you unsure, take this as a cue to review the details yourself and form an independent stance. You can then weigh those positives against the risks highlighted in 3 key rewards
Looking for more investment ideas beyond 1st Source?
If you like what you see in 1st Source but do not want to rely on a single stock, cast a wider net with other filtered opportunities.
Use the Simply Wall Street Screener to uncover fresh stock ideas that match your risk tolerance and return goals, instead of waiting and possibly missing opportunities.
- Target potential mispricing by scanning for companies that combine quality fundamentals with attractive valuations through the 51 high quality undervalued stocks.
- Strengthen your income focus by reviewing stocks that offer higher yields and resilient payout histories via the 8 dividend fortresses.
- Prioritise resilience by homing in on companies with healthier balance sheets using the solid balance sheet and fundamentals stocks screener (49 results).
This article by Simply Wall St is general in nature. We provide commentary based on historical data and analyst forecasts only using an unbiased methodology and our articles are not intended to be financial advice. It does not constitute a recommendation to buy or sell any stock, and does not take account of your objectives, or your financial situation. We aim to bring you long-term focused analysis driven by fundamental data. Note that our analysis may not factor in the latest price-sensitive company announcements or qualitative material. Simply Wall St has no position in any stocks mentioned.
Have feedback on this article? Concerned about the content? Get in touch with us directly. Alternatively, email editorial-team@simplywallst.com