


As European markets continue to show resilience, with the STOXX Europe 600 Index reaching new highs driven by robust corporate earnings and a positive shift in sentiment towards AI-related stocks, investors are increasingly looking for stable income opportunities amidst market volatility. In this context, dividend stocks offer an attractive option for those seeking consistent returns, as they combine potential capital appreciation with regular income streams.
Top 10 Dividend Stocks In Europe
| Name | Dividend Yield | Dividend Rating |
| Zurich Insurance Group (SWX:ZURN) | 4.08% | ★★★★★★ |
| UNIQA Insurance Group (WBAG:UQA) | 4.00% | ★★★★★☆ |
| Telekom Austria (WBAG:TKA) | 4.17% | ★★★★★★ |
| Swiss Re (SWX:SREN) | 4.78% | ★★★★★★ |
| Rubis (ENXTPA:RUI) | 6.19% | ★★★★★★ |
| Iren (BIT:IRE) | 5.46% | ★★★★★★ |
| Hannover Rück (XTRA:HNR1) | 4.98% | ★★★★★★ |
| Edel SE KGaA (XTRA:EDL) | 6.25% | ★★★★★★ |
| d'Amico International Shipping (BIT:DIS) | 4.85% | ★★★★★☆ |
| Cembra Money Bank (SWX:CMBN) | 5.12% | ★★★★★★ |
Click here to see the full list of 191 stocks from our Top European Dividend Stocks screener.
Here we highlight a subset of our preferred stocks from the screener.
BPER Banca (BIT:BPE)
Simply Wall St Dividend Rating: ★★★★☆☆
Overview: BPER Banca SpA provides banking products and services to individuals, businesses, and professionals in Italy and internationally, with a market cap of €30.25 billion.
Operations: BPER Banca SpA generates revenue through its banking products and services tailored for individuals, businesses, and professionals both within Italy and on an international scale.
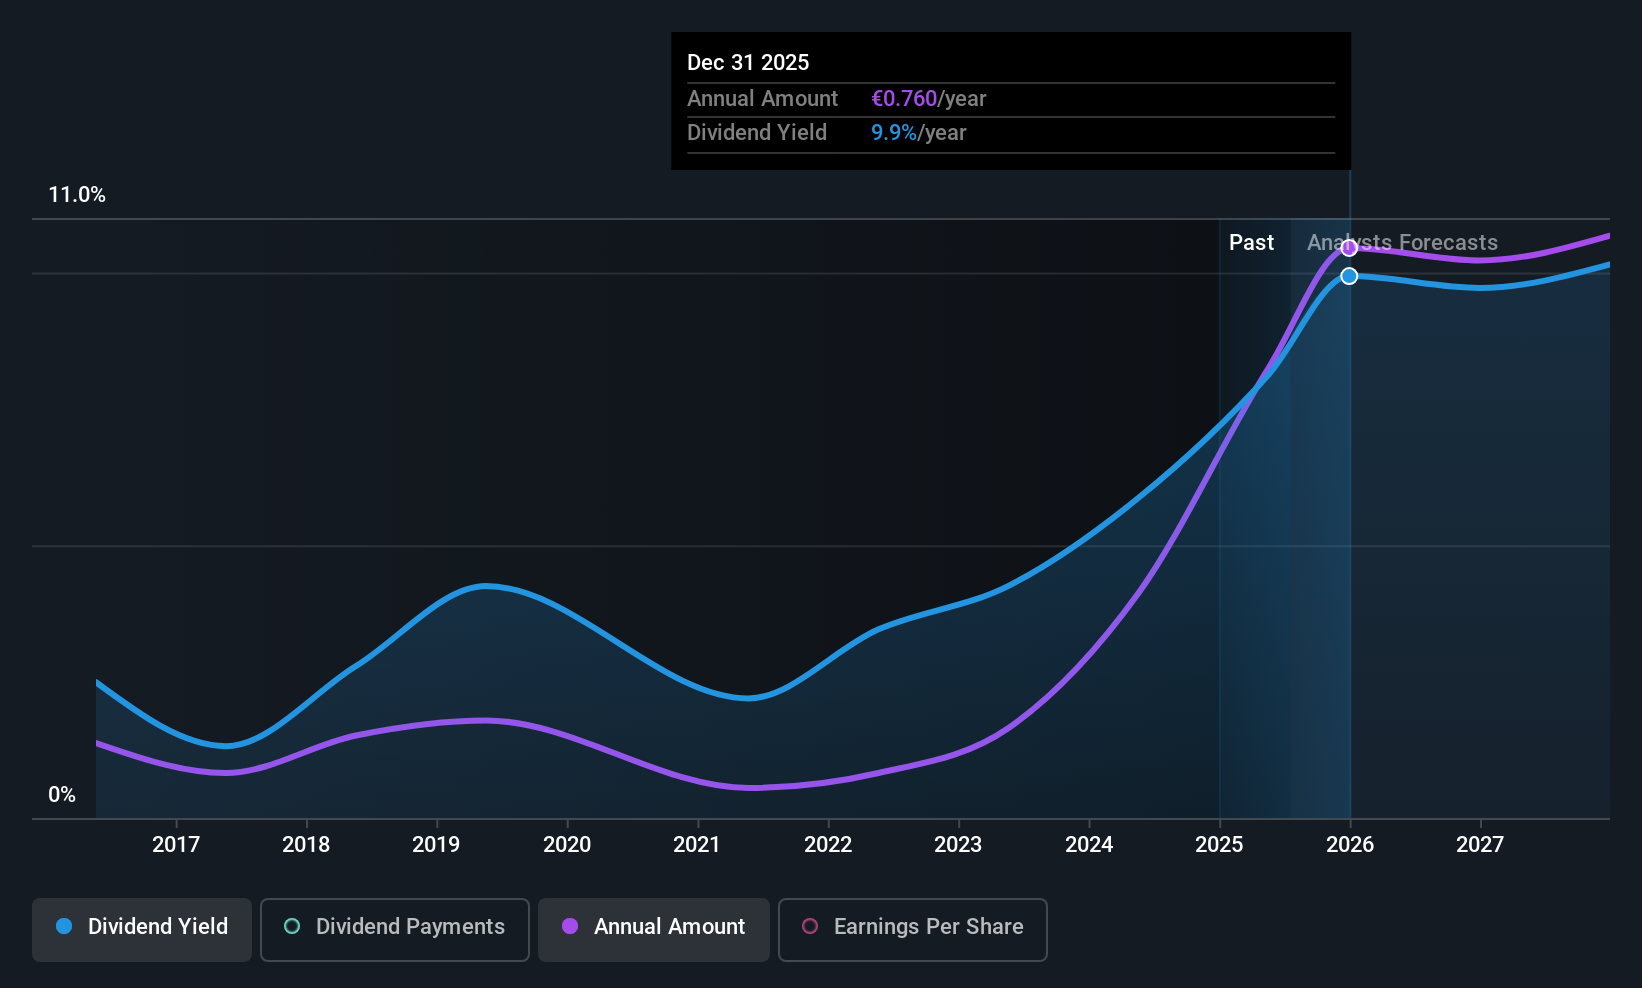
Dividend Yield: 4.5%
BPER Banca's dividend payments are currently covered by earnings with a payout ratio of 61.2%, though their yield of 4.48% is slightly below the top tier in Italy. Despite increasing dividends over the past decade, they have been volatile and unreliable. Earnings grew by 36.4% last year, supporting future dividend coverage forecasts at a higher payout ratio of 79.5%. Recent activities include redeeming €500 million in notes and completing a €500 million fixed-income offering.
- Navigate through the intricacies of BPER Banca with our comprehensive dividend report here.
- Our comprehensive valuation report raises the possibility that BPER Banca is priced higher than what may be justified by its financials.
Gaztransport & Technigaz (ENXTPA:GTT)
Simply Wall St Dividend Rating: ★★★★☆☆
Overview: Gaztransport & Technigaz SA is a technology and engineering company specializing in cryogenic membrane containment systems for maritime transportation and storage of liquefied gases, with a market cap of €7.32 billion.
Operations: Gaztransport & Technigaz SA generates revenue from its hydrogen segment, amounting to €2.20 million.
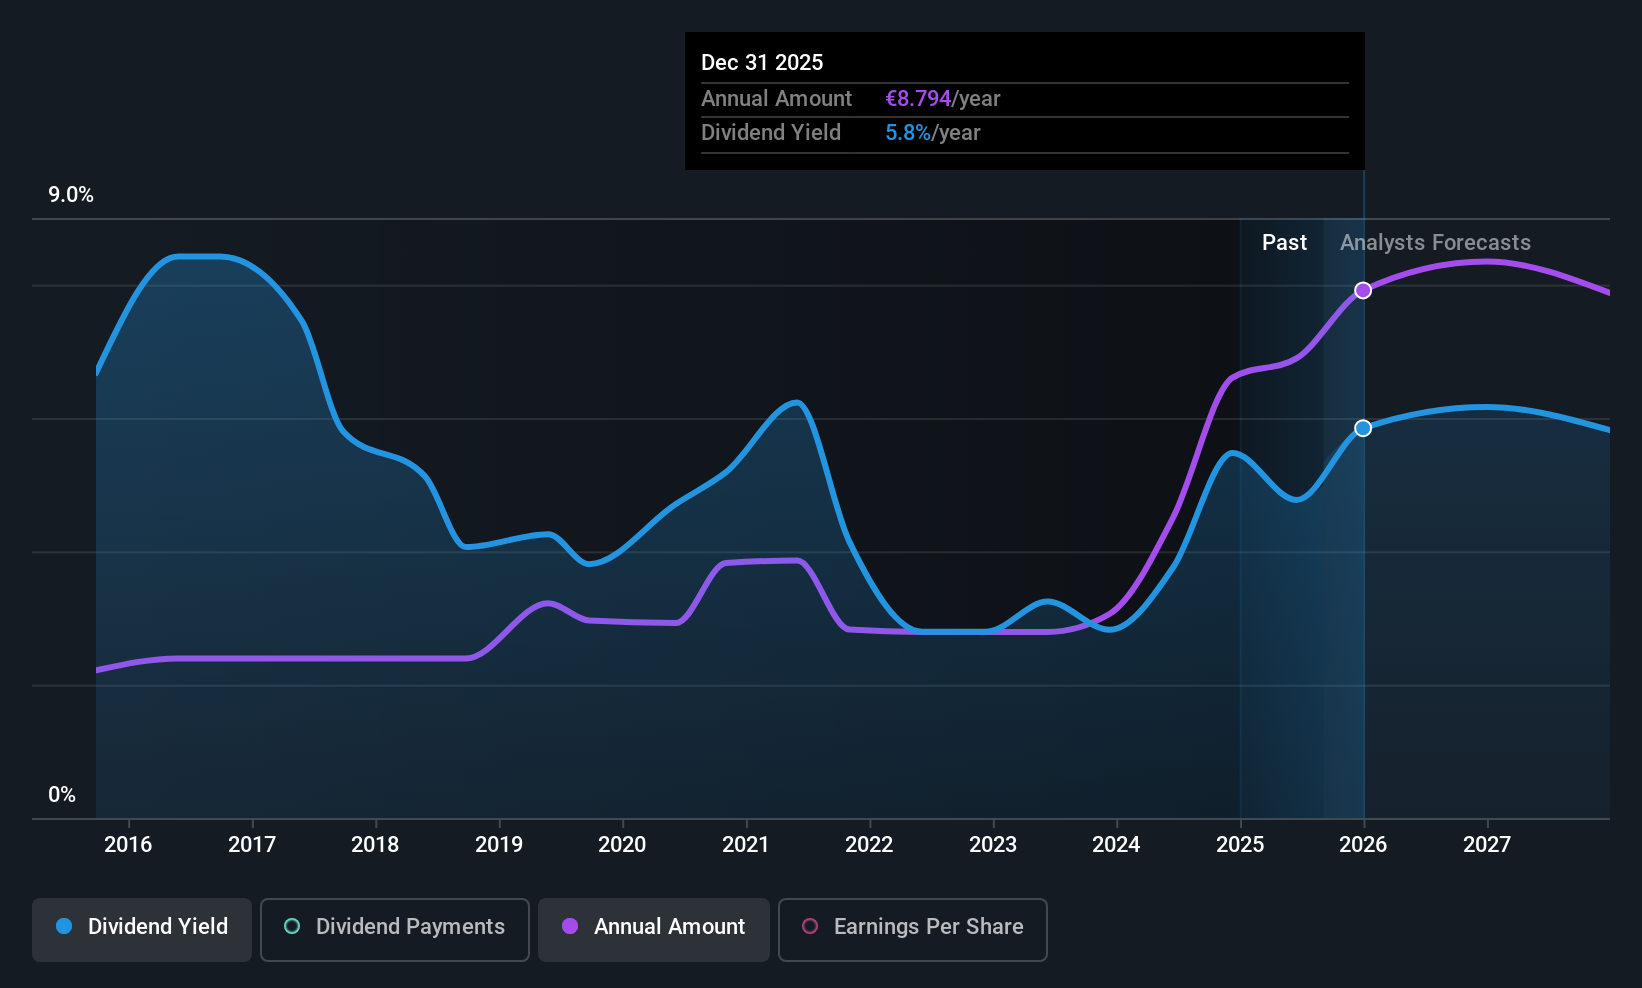
Dividend Yield: 5%
Gaztransport & Technigaz's dividend payments, while covered by earnings and cash flows with payout ratios of 77.1% and 80.2% respectively, have been historically volatile over the past decade. Despite recent increases, including an interim dividend of €4.30 per share announced for December 2026, the company's dividends remain unreliable due to past fluctuations. Recent half-year earnings showed a net income rise to €210.4 million from €180 million last year, indicating improved profitability despite stable sales figures.
- Click here to discover the nuances of Gaztransport & Technigaz with our detailed analytical dividend report.
- Our valuation report here indicates Gaztransport & Technigaz may be undervalued.
Manitou BF (ENXTPA:MTU)
Simply Wall St Dividend Rating: ★★★★☆☆
Overview: Manitou BF SA, along with its subsidiaries, develops, manufactures, and distributes equipment and services across various regions including France, Southern Europe, Northern Europe, the Americas, Asia, the Pacific, Africa, and the Middle East; it has a market cap of €874.38 million.
Operations: Manitou BF SA's revenue is derived from its operations in the development, manufacture, and distribution of equipment and services across multiple global regions.
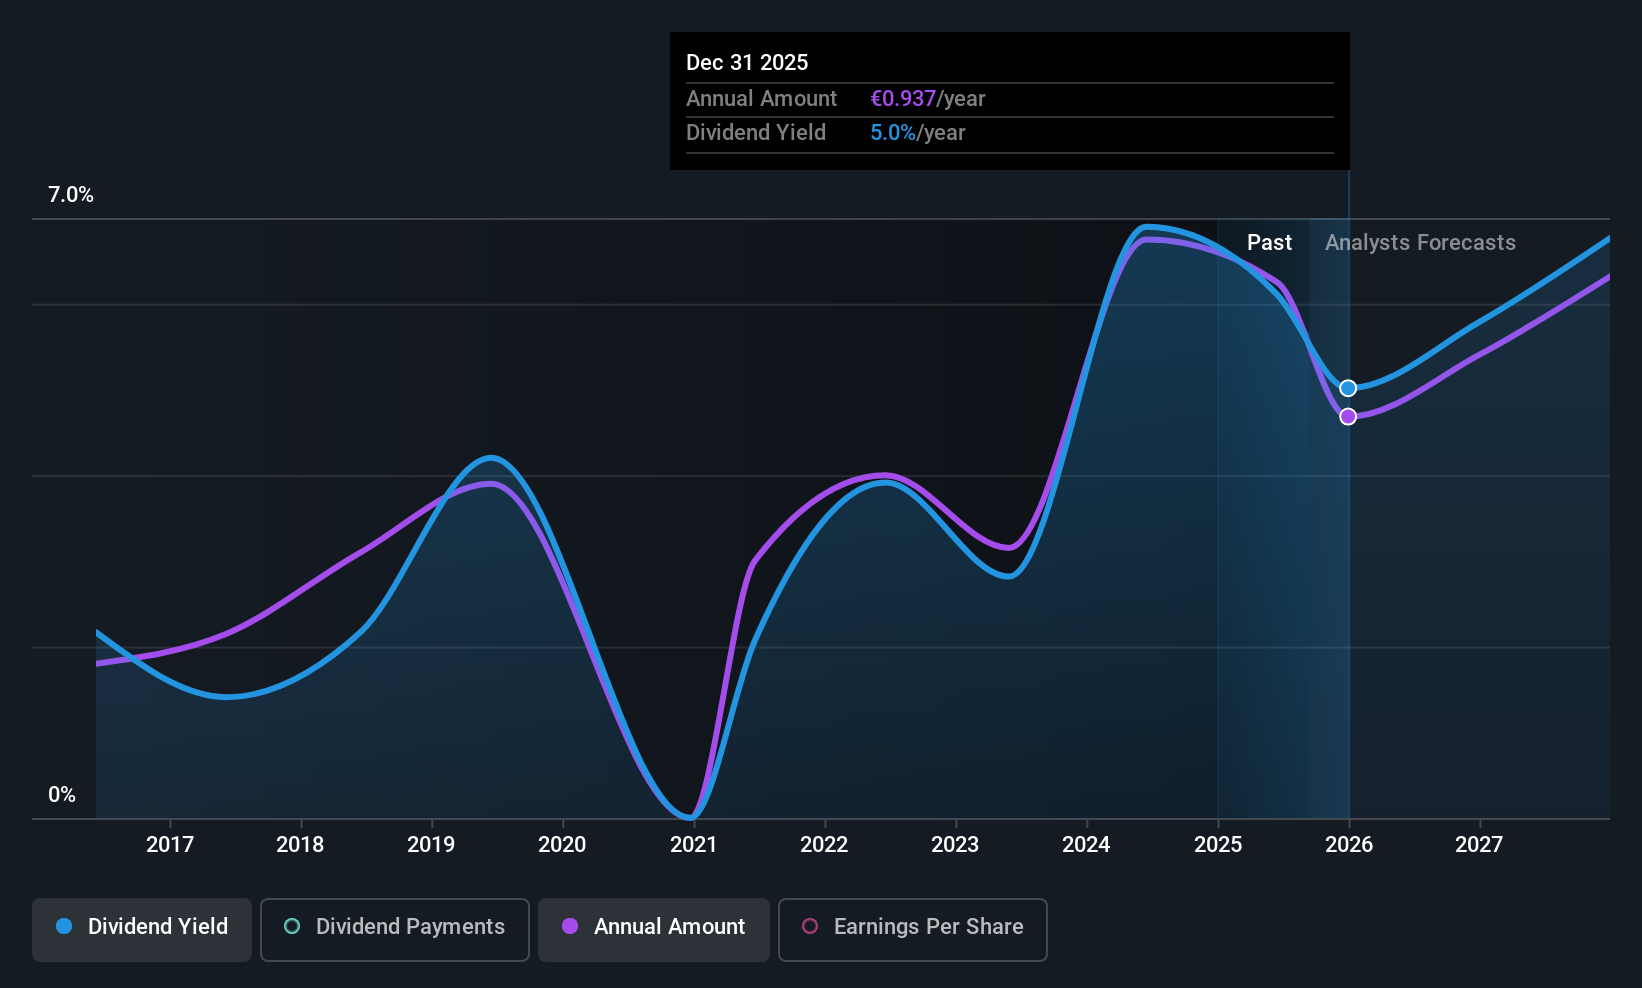
Dividend Yield: 3.3%
Manitou BF's recent half-year results show a net income increase to €51.25 million from €32.67 million, reflecting improved profitability. Despite a low payout ratio of 41.9% and dividends being well covered by earnings and cash flows, the company's dividend history has been volatile over the past decade, indicating unreliability. The stock trades at a favorable price-to-earnings ratio of 10.1x compared to the French market average of 16.4x, suggesting good relative value for investors seeking dividend stocks in Europe.
- Delve into the full analysis dividend report here for a deeper understanding of Manitou BF.
- Our comprehensive valuation report raises the possibility that Manitou BF is priced lower than what may be justified by its financials.
Key Takeaways
- Take a closer look at our Top European Dividend Stocks list of 191 companies by clicking here.
- Already own these companies? Bring clarity to your investment decisions by linking up your portfolio with Simply Wall St, where you can monitor all the vital signs of your stocks effortlessly.
- Take control of your financial future using Simply Wall St, offering free, in-depth knowledge of international markets to every investor.
Ready To Venture Into Other Investment Styles?
- Explore high-performing small cap companies that haven't yet garnered significant analyst attention.
- Fuel your portfolio with companies showing strong growth potential, backed by optimistic outlooks both from analysts and management.
- Find companies with promising cash flow potential yet trading below their fair value.
This article by Simply Wall St is general in nature. We provide commentary based on historical data and analyst forecasts only using an unbiased methodology and our articles are not intended to be financial advice. It does not constitute a recommendation to buy or sell any stock, and does not take account of your objectives, or your financial situation. We aim to bring you long-term focused analysis driven by fundamental data. Note that our analysis may not factor in the latest price-sensitive company announcements or qualitative material. Simply Wall St has no position in any stocks mentioned.
Have feedback on this article? Concerned about the content? Get in touch with us directly. Alternatively, email editorial-team@simplywallst.com