


The Zhitong Finance App learned that in July 2026, Kerui Real Estate Research published an article stating that in July 2026, the land market entered a phased correction after experiencing concentrated volume in June. Both supply and demand sides showed a month-on-month decline, but competition for high-quality residential land in core cities is still fierce. According to Kerui data, the construction area of the 50 key cities in the month was 9.7936 million square meters, down 9.1% year on year and 18.0% month on month; land transaction area was 8.7764 million square meters, down 17.2% year on year and 25.9% month on month; the average premium rate fell back to 14.93%, down 8.13 percentage points from June, but still 4.32 percentage points higher than the same period last year. High-value land plots in core cities such as Shanghai, Beijing, and Hangzhou have been successfully sold, and the “absorption power” of high-quality assets has not diminished.
Supply was phased back, total transaction volume declined, but core city value was highlighted
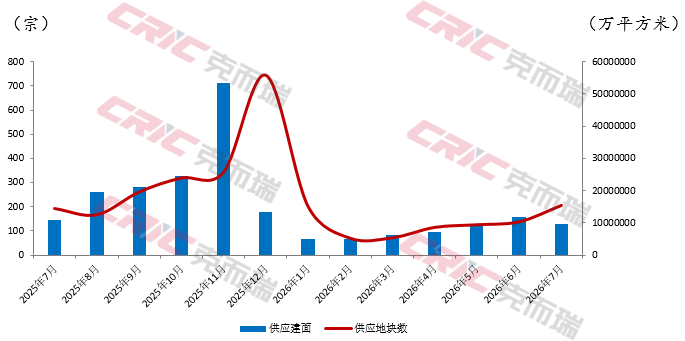
In terms of land supply, in July 2026, the scale of land supply in the 50 key cities declined markedly after a phased peak in June. 205 plots were supplied in a single month, with a total land supply area of about 9.7936 million square meters, down 9.1% year on year and 18.0% month on month. Among them:
Among first-tier cities, Beijing has a construction area of about 754,500 square meters, ranking first among first-tier cities; Shanghai has a construction area of about 507 million square meters, Guangzhou has about 455,400 square meters, and Shenzhen has no new residential land supply.
Among second-tier cities, Xi'an and Chongqing lead the supply scale, with a construction area of about 895,900 square meters and 772,600 square meters respectively, ranking in the top two second-tier cities; cities such as Jinan, Nanning, Shenyang, Nanjing, and Ningbo also have prominent supply volumes, and the land supply structure is still dominated by high-energy cities.
Among the third- and fourth-tier cities, Zhenjiang supplies about 787,800 square meters, ranking first in the third and fourth tier; the supply scale of Nantong, Xuzhou, Wenzhou, and Wuxi is also prominent; all other cities have a supply scale of less than 200,000 square meters or no land supply.
Overall, the supply side showed two characteristics in July: first, at the total volume level, due to the pace adjustment after centralized land supply in June, supply construction fell 18.0% month-on-month and 9.1% year-on-year, and land supply entered a phased reduction channel; second, at the city level, land supply was concentrated in Tier 1 and 2 core cities such as Xi'an, Chongqing, Beijing, and Shanghai. Among the third- and fourth-tier cities, only a few cities such as Zhenjiang, Nantong, and Xuzhou had prominent supply volumes. Most cities had low or zero land supply levels, with significant differentiation between cities.
Figure 1 Monthly supply of residential land in key 50 cities from July 2025 to July 2026
Data source: CRIC.
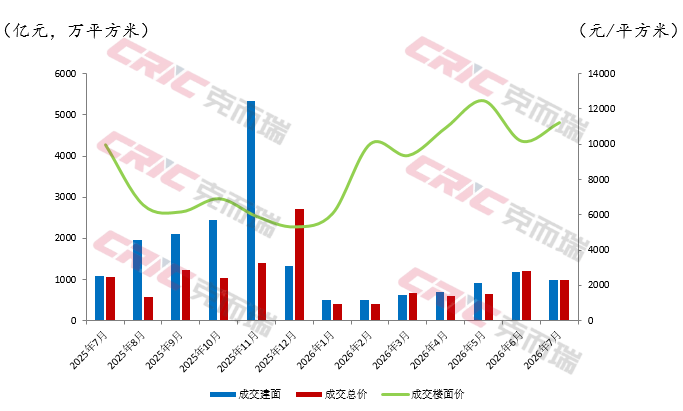
In terms of transactions, in July 2026, the scale of land transactions in the 50 key cities declined significantly. The total construction area of the transaction was about 8.776,400 square meters, down 17.24% year on year and 25.86% month on month; the total transaction price was about 98.504 billion yuan, down 6.79% year on year and 18.19% month on month; the average transaction price was about 1,1224 yuan/square meter, up 12.63% year on year and 10.35% month on month. The month-on-month increase in average transaction prices was mainly driven by the optimization of the land supply structure — the share of high-value land transactions in core cities such as Shanghai, Beijing, Hangzhou, and Shenzhen increased dramatically in the same month, raising the overall average price level.
Figure 2 Monthly residential land transactions in 50 key cities from June 2025 to June 2026
Data source: CRIC.
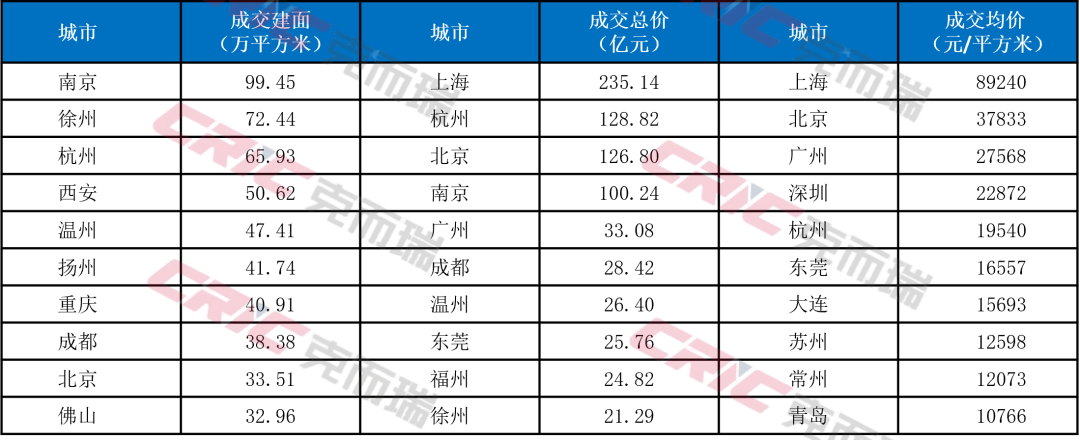
Judging from the city's performance, in terms of construction area, Nanjing ranked first with 994,500 square meters; Xuzhou, Hangzhou, Xi'an, Wenzhou, and Yangzhou ranked second to sixth; Chongqing, Chengdu, Beijing, and Foshan also had a construction area of over 300,000 square meters. In terms of total transaction prices, Shanghai led with a fault of about 23.514 billion yuan, followed by Hangzhou, Beijing, and Nanjing. The total transaction price of the four cities accounted for about 60% of the total transaction price of the 50 cities, and the agglomeration effect in core cities was remarkable. In terms of average transaction price, Shanghai is leading the way with a fault of about 89,240 yuan/square meter. Beijing, Guangzhou, Shenzhen, and Hangzhou rank in the top five. They are all first-tier and second-tier cities. The value of high-quality land in core cities continues to stand out.
Table 1 Top 10 residential land transactions involving construction surface, total transaction price, and average transaction price in the 50 key cities in July 2026
Data source: CRIC.
The premium rate fell from a high level, and the streaming rate remained low
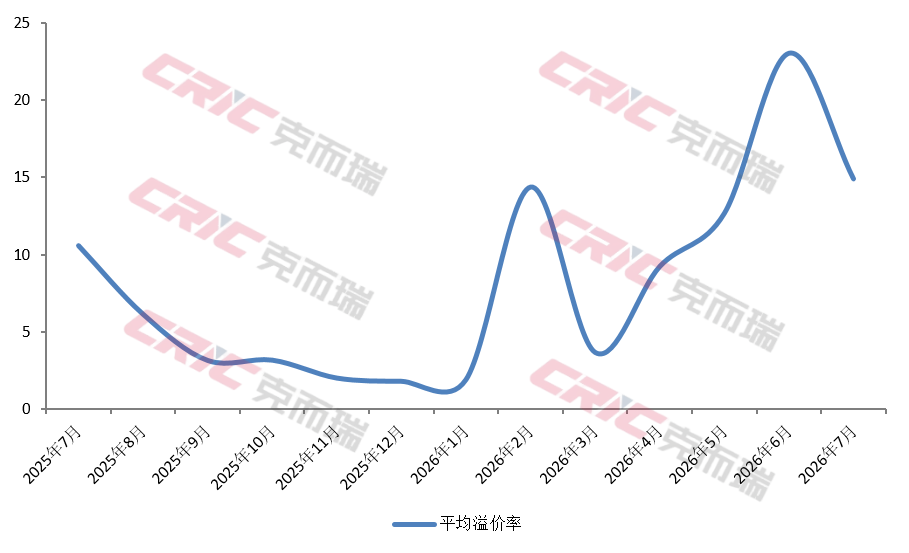
In July 2026, the average land premium rate in the 50 cities was 14.93%, down 8.13 percentage points from the 23.06% high in June, but still 4.32 percentage points higher than 10.61% in July 2025. High-quality land plots in core cities can still achieve higher premium transactions, but the number of ultra-premium (with a premium rate of more than 50%) was drastically reduced compared to June.
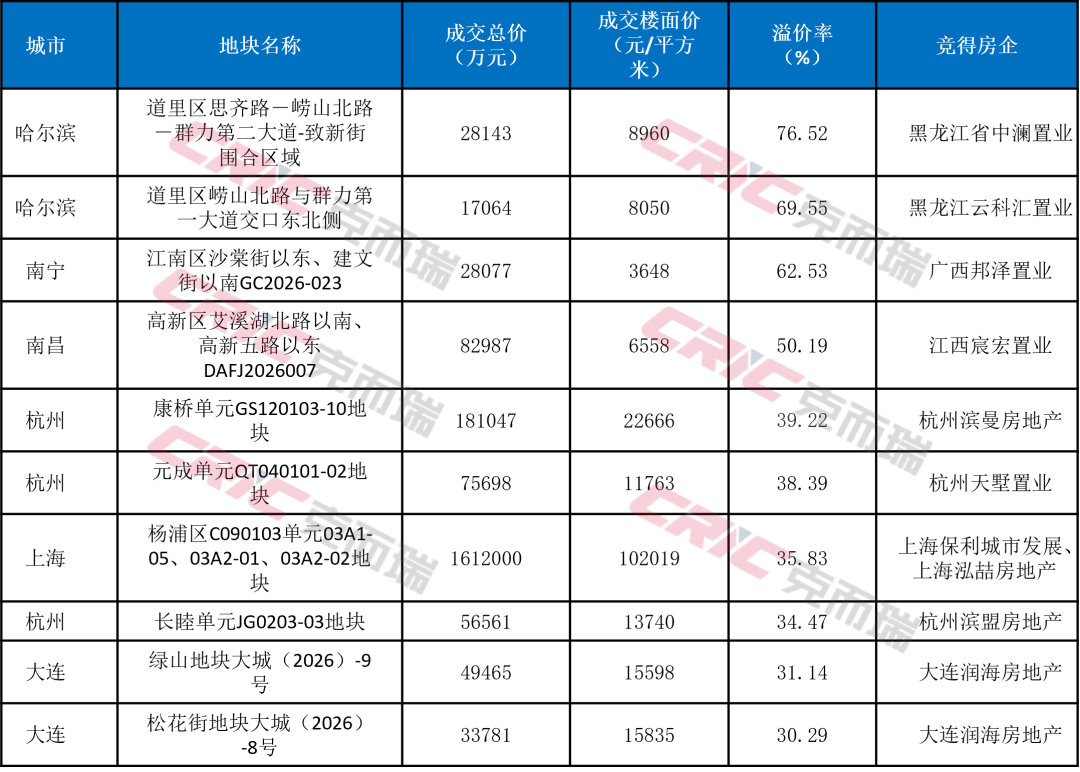
Looking at specific plots, the plot with the highest premium rate in July came from two parcels of residential land in Daoli District of Harbin, with premium rates of 76.52% and 69.55% respectively, which is a high structural premium in the regional market; the GC2026-023 plot in Jiangnan District of Nanning had a premium rate of 62.53%, the premium rate for the DAFJ2026007 plot in the Nanchang High-tech Zone was 50.19%, and the premium rate for the GS120103-10 plot in Kangqiao Unit, Hangzhou was 39.22%. However, in June, Shenzhen and Hangzhou saw a number of plots with premium rates of more than 60% or even more than 100%, and ultra-high premium transactions in the July market cooled down markedly.
Overall, the number of high-premium plots and premium rates declined somewhat in July, but high-quality land in core cities was still able to maintain a certain premium level, indicating that housing companies' will to compete for high-quality assets with strong certainty still exists, but bids are becoming more cautious.
Figure 3 Monthly trend of average premium rates for residential land transactions in 50 key cities from June 2025 to June 2026
(%)
Data source: CRIC.
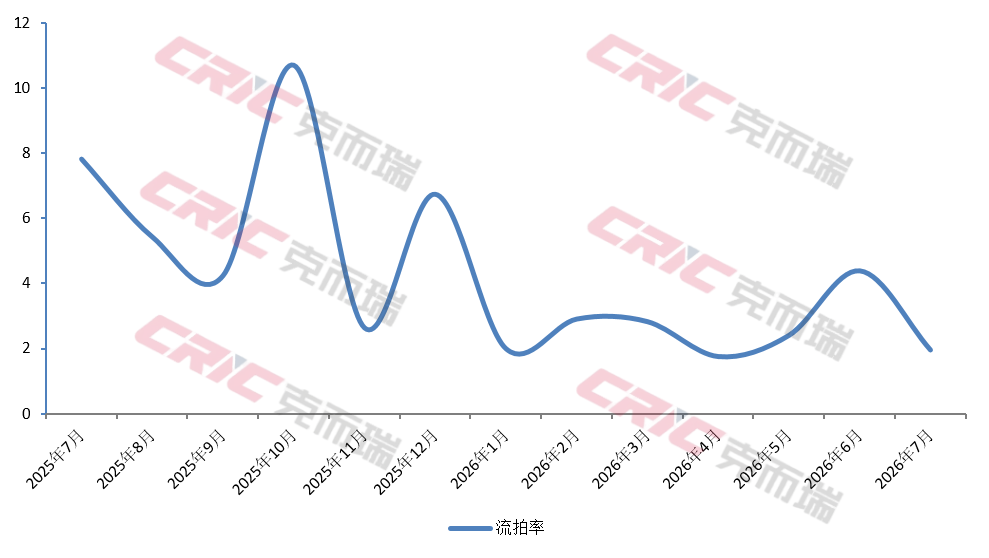
The land flow rate in July was 1.95%, a significant drop from 4.38% in June, and is at a low level since the in-depth adjustment of real estate. Streamlined plots are mainly concentrated in third- and fourth-tier cities. Basically, all high-quality plots in core cities have been successfully sold, and the pattern of market differentiation continues.
Figure 4 Monthly trend of residential land flow rate in 50 key cities from July 2025 to July 2026
(%)
Data source: CRIC.
Shanghai leads the total price list, and Harbin is at the top of the premium rate
Judging from the three dimensions of total price, unit price, and premium rate, the popularity of the land market in July was highly concentrated in core cities such as Shanghai, Beijing, Hangzhou, and Nanjing, but the distribution of cities was more scattered than in June. Among the first-tier cities, Shanghai and Beijing showed outstanding performance, and Guangzhou also had 2 parcels of land ranked in the top ten unit prices.
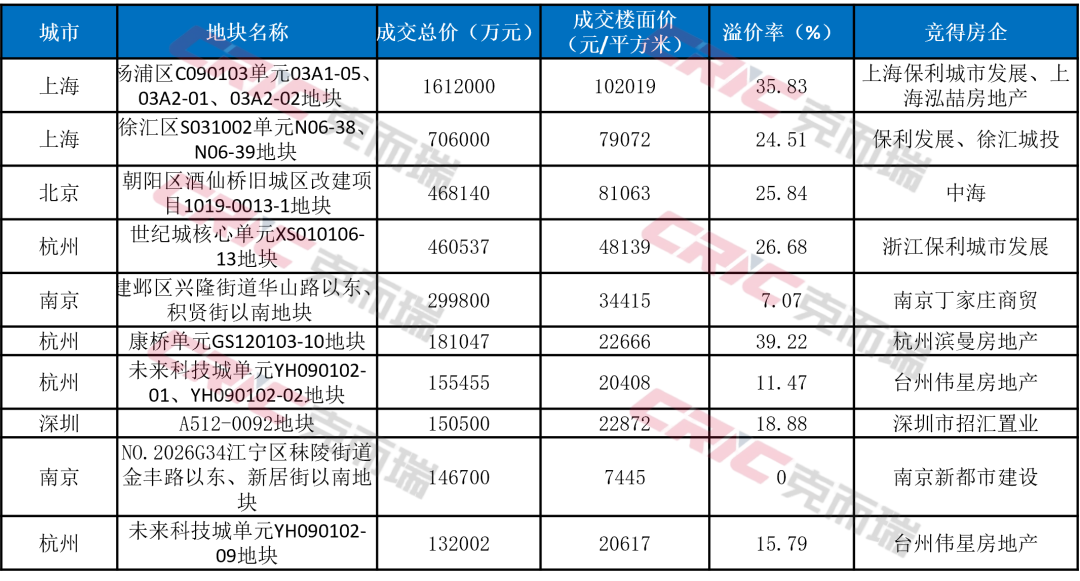
In terms of total price TOP10, the C090103 plot in Yangpu District of Shanghai ranked first with 16.12 billion yuan, and was also the only plot with a total transaction price of over 10 billion yuan in the same month; the S031002 plot in Xuhui District of Shanghai ranked second with 7.06 billion yuan; the 1019-0013-1 plot of the Jiuxianqiao Old Town Renovation Project in Chaoyang District of Beijing ranked third with 4.681 billion yuan. Of the TOP10, Hangzhou accounts for 4 cases, Shanghai accounts for 2 cases, Nanjing accounts for 2 cases, and Beijing and Shenzhen each account for 1 case.
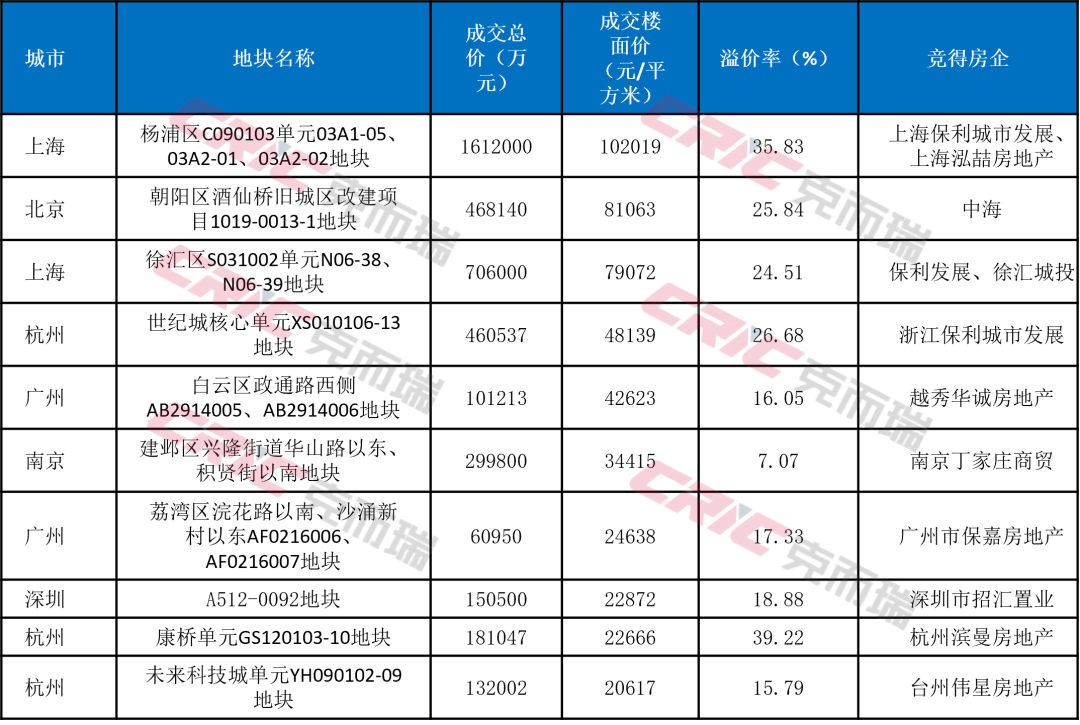
In terms of the top 10 unit prices, the Shanghai Yangpu District plot peaked with a floor price of 102019 yuan/square meter, the 1019-0013-1 plot of the Jiuxianqiao Old Town Renovation Project in Chaoyang District of Beijing ranked second with 81,063 yuan/square meter, and the Shanghai Xuhui District plot ranked third with 7,9072 yuan/square meter. Among the top ten land plots in unit price, Hangzhou accounted for 3 cases, Shanghai accounted for 2 cases, Guangzhou accounted for 2 cases, and Beijing, Nanjing, and Shenzhen each accounted for 1 case. The value of high-end land plots in first-tier cities continues to be recognized by the market.
In terms of the top 10 premium rates, two parcels of land in Harbin occupied the top two, with premium rates of 76.52% and 69.55% respectively; Nanning ranked third with a premium rate of 62.53% for GC2026-023 land, ranked fourth with a premium rate of 50.19% for the Nanchang High-tech Zone, and ranked fifth with a premium rate of 39.22% for Kangqiao units in Hangzhou. Unlike Shenzhen, which covered the top three premium rates in June, the distribution of cities on the July premium rate list was more scattered. Cities such as Harbin, Nanning, and Nanchang experienced high premiums due to scarce regional land supply, but their magnitude and influence were not as high as Shenzhen's “10 billion+ super premium” combination in June.
Taken together, the key words of the July land market were “pullback and differentiation” — Shanghai had outstanding performance in the total price and unit price lists. Although Shenzhen and Hangzhou still had high-quality land transactions, neither the premium rate nor the total price scale was as large as in June; cities such as Harbin and Nanning experienced individual high-premium plots due to local land supply shortages, but this did not change the structural characteristics of the overall market. The long-term logic of “high-quality assets in core cities being sought after” in the land market has not changed, but short-term popularity is affected by the pace of land supply showing clear monthly fluctuations.
Table 2 Top 10 total residential land transaction prices in key 50 cities in July 2026
Data source: CRIC.
Table 3 Top 10 residential land transaction unit prices in key 50 cities in June 2026
Data source: CRIC.
Table 4 Top 10 premium rates for residential land transactions in 50 key cities in June 2026
Data source: CRIC.