


CTS (CTS) has drawn fresh attention after reporting higher second quarter and year to date sales and net income, alongside a raised 2026 sales guidance range, indicating improving business momentum.
See our latest analysis for CTS.
CTS shares have pulled back slightly with a 1 day share price return of a 0.71% decline, but the 7 day and 30 day share price returns of 8.53% and 10.67%, combined with a 52.29% year to date share price return and a 74.44% 1 year total shareholder return, point to strong momentum that aligns with the recent earnings beat, raised 2026 sales guidance and ongoing share buybacks.
If CTS’s recent move has you thinking about where else growth might emerge, this is a good moment to scan 35 robotics and automation stocks as potential next ideas.
CTS now appears to be a stronger business based on recent results and buybacks. The harder question is whether the share price already reflects that strength or still leaves room based on today’s valuation setup.
Most Popular Narrative: 3% Overvalued
The most followed narrative currently places CTS fair value at $65, which sits slightly below the last close at $66.78. That gap comes from a detailed set of growth, margin and buyback assumptions that investors can weigh against the current share price.
The company's continued diversification into high-growth end markets such as medical (with particular momentum in therapeutic and portable ultrasound applications) and industrial (with new wins in EV charging, automation, and connectivity solutions) positions CTS to benefit from the accelerating adoption of smart, connected, and electrified technologies, supporting sustained future revenue growth and enhanced margin mix.
Read the complete narrative. Read the complete narrative.
If you want to see what is really behind that $65 figure, focus on how CTS blends mid single digit revenue growth with improving margins and a lower future P/E multiple. The narrative also bakes in steady share count reduction. The full breakdown spells out exactly how those moving parts translate into today’s fair value.
Result: Fair Value of $65 (OVERVALUED)
Have a read of the narrative in full and understand what's behind the forecasts.
However, CTS still faces meaningful risks if transportation demand stays weak, or if trade and geopolitical pressures raise costs and unsettle customer orders.
Find out about the key risks to this CTS narrative.
Another View on CTS Using Market Ratios
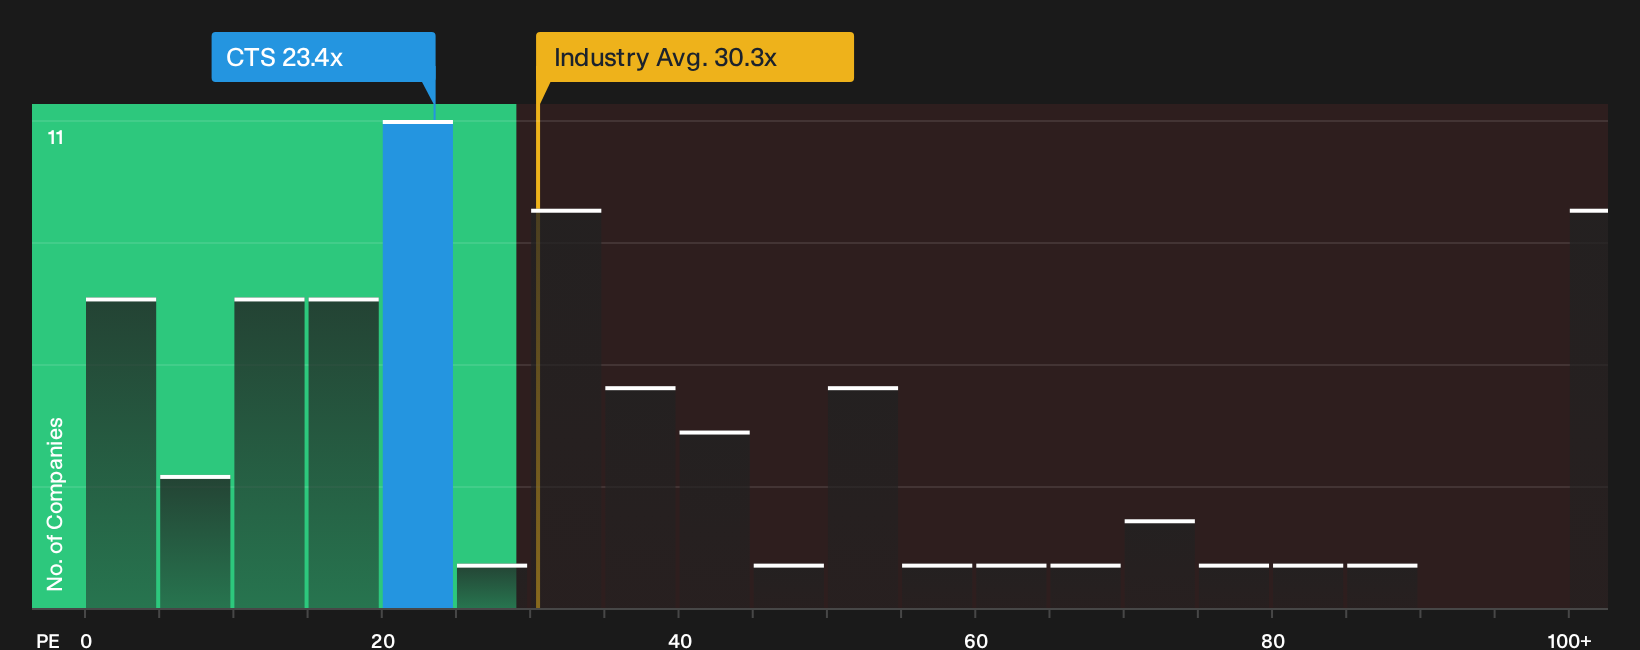
The earlier fair value of $65 for CTS leans on detailed growth and margin assumptions. The current P/E of 27.3x is below the US Electronic industry at 32.5x and well under peer average at 65.7x, yet above a fair ratio of 22.6x. Is that a cushion or a warning signal?
See what the numbers say about this price — find out in our valuation breakdown.
Next Steps
CTS has attracted plenty of attention in this article, so now is a good time to look at the numbers yourself and act while the details are fresh. To see why some investors are optimistic about its potential rewards, take a closer look at the 3 key rewards
Looking for more CTS investment ideas?
If CTS has sharpened your interest in what else the market offers, you could broaden your research using the Simply Wall St Screener to explore more opportunities.
- Target higher quality opportunities by scanning companies that currently show up in the 51 high quality undervalued stocks.
- Consider strengthening your downside protection by reviewing stocks highlighted in the 79 resilient stocks with low risk scores.
- Spot underfollowed opportunities early by checking the screener containing 17 high quality undiscovered gems.
This article by Simply Wall St is general in nature. We provide commentary based on historical data and analyst forecasts only using an unbiased methodology and our articles are not intended to be financial advice. It does not constitute a recommendation to buy or sell any stock, and does not take account of your objectives, or your financial situation. We aim to bring you long-term focused analysis driven by fundamental data. Note that our analysis may not factor in the latest price-sensitive company announcements or qualitative material. Simply Wall St has no position in any stocks mentioned.
Have feedback on this article? Concerned about the content? Get in touch with us directly. Alternatively, email editorial-team@simplywallst.com