


As the Canadian market experiences solid earnings growth with 64% of S&P/TSX companies surpassing estimates, investors are keenly observing how broader participation in earnings can enhance market stability. In this environment, identifying undervalued stocks becomes crucial, as these opportunities may offer potential for growth amid resilient economic conditions and steady consumer spending.
Top 10 Undervalued Stocks Based On Cash Flows In Canada
| Name | Current Price | Fair Value (Est) | Discount (Est) |
| TFI International (TSX:TFII) | CA$195.41 | CA$382.91 | 49% |
| SSR Mining (TSX:SSRM) | CA$40.60 | CA$73.81 | 45% |
| OceanaGold (TSX:OGC) | CA$37.67 | CA$70.18 | 46.3% |
| Medexus Pharmaceuticals (TSX:MDP) | CA$4.97 | CA$9.15 | 45.7% |
| Mattr (TSX:MATR) | CA$17.77 | CA$34.52 | 48.5% |
| Groupe Dynamite (TSX:GRGD) | CA$62.36 | CA$116.79 | 46.6% |
| Gildan Activewear (TSX:GIL) | CA$81.44 | CA$146.54 | 44.4% |
| Constellation Software (TSX:CSU) | CA$3145.19 | CA$6264.79 | 49.8% |
| Chemtrade Logistics Income Fund (TSX:CHE.UN) | CA$16.22 | CA$29.10 | 44.3% |
| Black Diamond Group (TSX:BDI) | CA$18.37 | CA$36.66 | 49.9% |
We're going to check out a few of the best picks from our screener tool.
Exchange Income (TSX:EIF)
Overview: Exchange Income Corporation operates in the aerospace, aviation, and manufacturing sectors globally, with a market cap of CA$7.27 billion.
Operations: The company's revenue is derived from CA$1.11 billion in manufacturing and CA$2.37 billion in aerospace and aviation segments.
Estimated Discount To Fair Value: 25%
Exchange Income is trading at CA$129.26, which is 25% below its estimated future cash flow value of CA$172.35, indicating it may be undervalued based on cash flows. The company has demonstrated strong earnings growth with a 51.9% increase over the past year and forecasts suggest continued robust earnings growth of 20.7% annually, outpacing the Canadian market average of 11.1%. However, dividend sustainability remains a concern as dividends are not well-covered by free cash flows and interest payments are not well covered by earnings.
- Our expertly prepared growth report on Exchange Income implies its future financial outlook may be stronger than recent results.
- Click to explore a detailed breakdown of our findings in Exchange Income's balance sheet health report.
OceanaGold (TSX:OGC)
Overview: OceanaGold Corporation is involved in the exploration, development, and operation of gold and gold/copper mines across the United States, the Philippines, and New Zealand with a market cap of CA$7.85 billion.
Operations: The company's revenue segments are comprised of $725.80 million from Haile, $317.10 million from Waihi, $517.90 million from Didipio, and $687 million from Macraes.
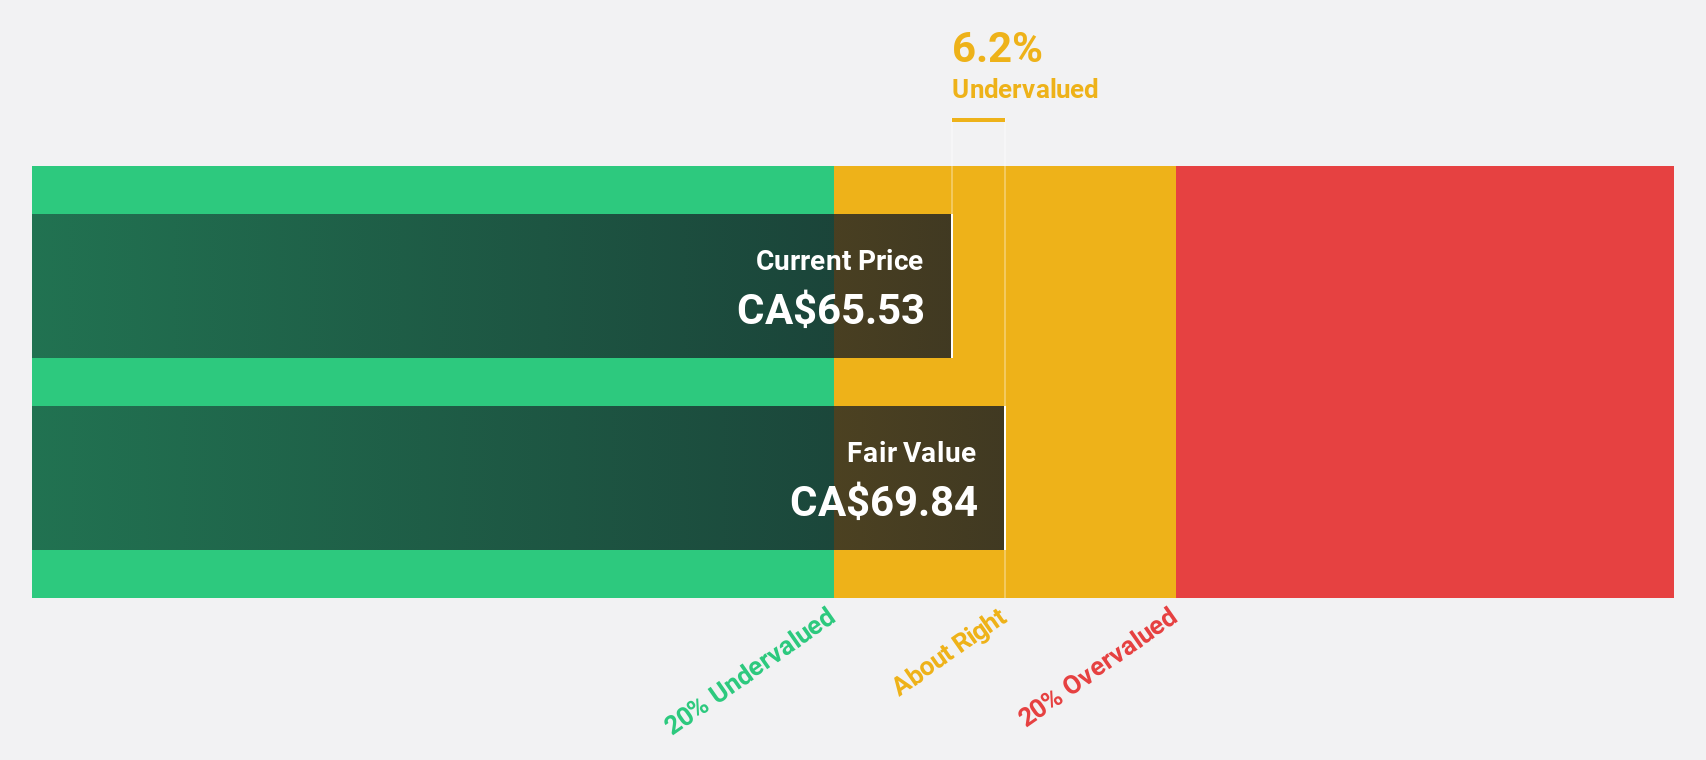
Estimated Discount To Fair Value: 46.3%
OceanaGold is trading at CA$37.67, significantly below its estimated future cash flow value of CA$70.18, highlighting potential undervaluation based on cash flows. The company reported strong financial performance with second-quarter sales of US$647.3 million and net income of US$222.2 million, reflecting robust earnings growth. Despite insider selling in the past quarter, OceanaGold's projected annual profit growth of 18.1% surpasses the Canadian market average and supports its expansion plans at Didipio Mine with a US$1.958 billion investment for long-term operations beyond 2035.
- According our earnings growth report, there's an indication that OceanaGold might be ready to expand.
- Click here to discover the nuances of OceanaGold with our detailed financial health report.

Wesdome Gold Mines (TSX:WDO)
Overview: Wesdome Gold Mines Ltd. is engaged in the mining, development, and exploration of gold and silver deposits in Canada, with a market cap of CA$4.06 billion.
Operations: The company's revenue is primarily derived from its Kiena and Eagle River segments, generating CA$413.44 million and CA$613.06 million respectively.
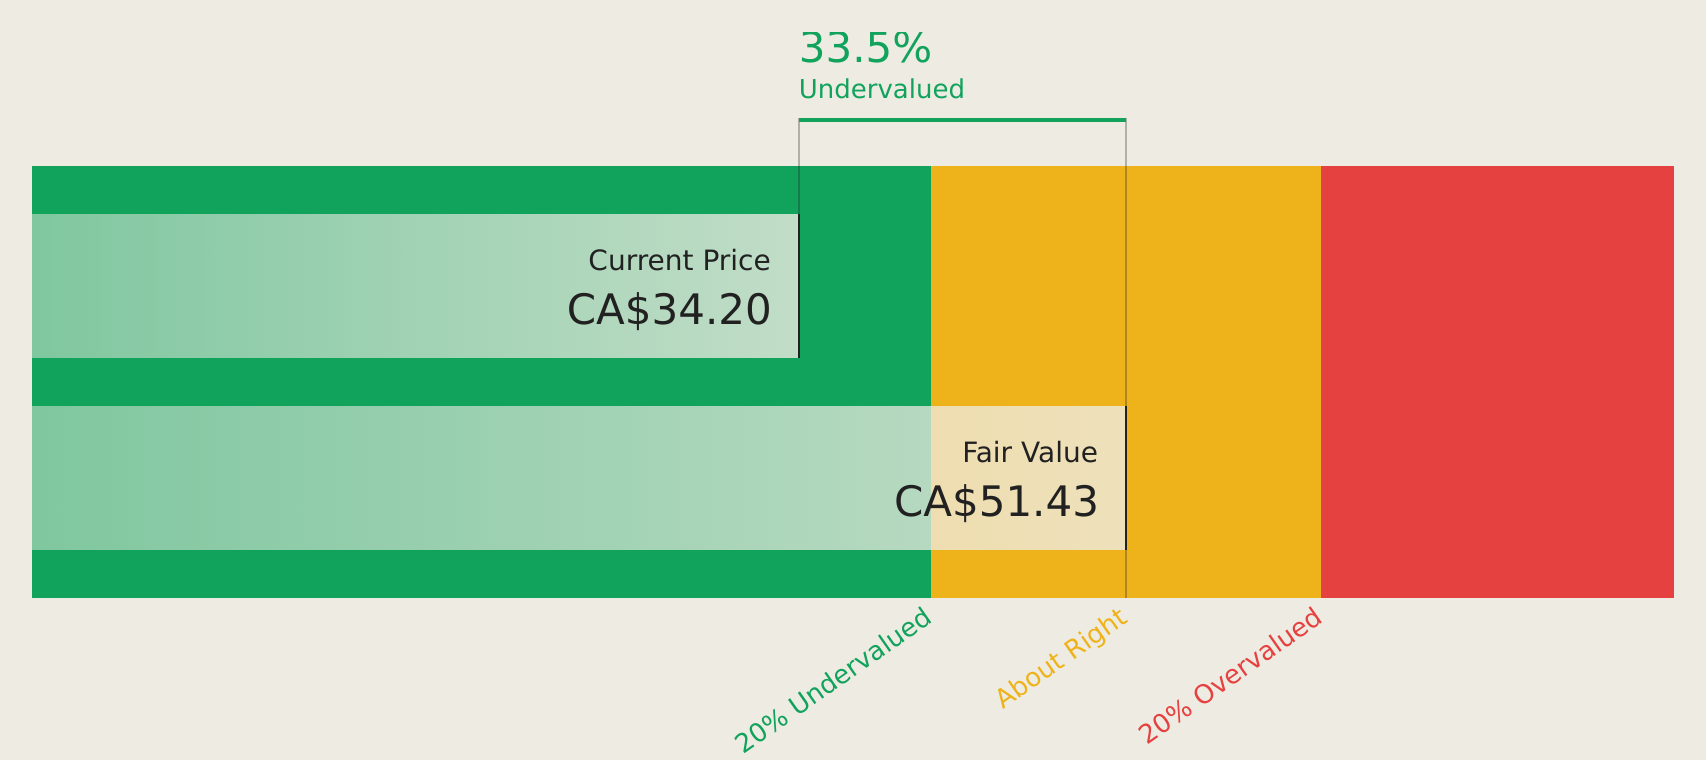
Estimated Discount To Fair Value: 39.9%
Wesdome Gold Mines, trading at CA$30.8, is undervalued based on future cash flow estimates of CA$51.27. Recent exploration updates reveal promising drilling results at Eagle River and Kiena mines, indicating potential resource growth. The company reported first-quarter sales of CAD 299.79 million and net income of CAD 118.88 million, showcasing strong financial performance despite recent insider selling activities. Projected annual earnings growth of 15.4% outpaces the Canadian market average, reinforcing its investment appeal based on cash flows.
- Our comprehensive growth report raises the possibility that Wesdome Gold Mines is poised for substantial financial growth.
- Unlock comprehensive insights into our analysis of Wesdome Gold Mines stock in this financial health report.
Next Steps
- Click this link to deep-dive into the 32 companies within our Undervalued TSX Stocks Based On Cash Flows screener.
- Got skin in the game with these stocks? Elevate how you manage them by using Simply Wall St's portfolio, where intuitive tools await to help optimize your investment outcomes.
- Enhance your investing ability with the Simply Wall St app and enjoy free access to essential market intelligence spanning every continent.
Ready To Venture Into Other Investment Styles?
- Explore high-performing small cap companies that haven't yet garnered significant analyst attention.
- Diversify your portfolio with solid dividend payers offering reliable income streams to weather potential market turbulence.
- Fuel your portfolio with companies showing strong growth potential, backed by optimistic outlooks both from analysts and management.
This article by Simply Wall St is general in nature. We provide commentary based on historical data and analyst forecasts only using an unbiased methodology and our articles are not intended to be financial advice. It does not constitute a recommendation to buy or sell any stock, and does not take account of your objectives, or your financial situation. We aim to bring you long-term focused analysis driven by fundamental data. Note that our analysis may not factor in the latest price-sensitive company announcements or qualitative material. Simply Wall St has no position in any stocks mentioned.
Have feedback on this article? Concerned about the content? Get in touch with us directly. Alternatively, email editorial-team@simplywallst.com