


What Kelt Exploration's Latest Earnings Tell You
Kelt Exploration (TSX:KEL) reported second quarter 2026 revenue of CA$193.42 million and net income of CA$44.68 million, compared with CA$106.95 million and CA$32.46 million a year earlier.
For the first half of 2026, the company posted revenue of CA$346.68 million and net income of CA$45.37 million, versus CA$234.21 million and CA$51.44 million in the same period of 2025.
See our latest analysis for Kelt Exploration.
Kelt Exploration's earnings release on 6 August 2026 came alongside a 1-day share price return of 4.73%, while the year-to-date share price return of 24.20% and 1-year total shareholder return of 44.66% indicate recent momentum supported by income and cash generation.
If you are looking beyond Kelt Exploration for other opportunities, this could be a good moment to review how the wider resources space is moving through the 31 elite gold producer stocks
Kelt Exploration shares now sit at CA$9.75 against analyst targets near CA$12.16 and an internal fair value estimate that implies an even larger gap. How far from fair value does that leave the current price?
Price-to-Earnings of 44.2x: Is it justified?
Kelt Exploration closed at CA$9.75 while carrying a P/E of 44.2x, compared with analyst targets that sit higher and an internal fair value estimate that is above both.
The P/E multiple compares the current share price with earnings per share. For an oil and gas producer like Kelt Exploration, it reflects what the market is willing to pay today for each dollar of current earnings.
A P/E of 44.2x is high relative to many established producers. That kind of multiple usually implies the market is pricing in meaningful future earnings strength or more resilient profitability than recent reported net margins of 9.1% might suggest.
Against peers, the gap is clear. Kelt Exploration trades at 44.2x earnings, compared with 18.7x for its selected peer group and 21.1x for the wider Canadian oil and gas industry. That is a materially richer valuation than both sets of comparables, which indicates investors are currently valuing each dollar of Kelt Exploration earnings well above the sector.
See what the numbers say about this price — find out in our valuation breakdown.
Result: Price-to-Earnings of 44.2x (OVERVALUED)
However, you still need to factor in risks like volatile commodity prices and potential changes to Canadian energy regulation that could challenge the current Kelt Exploration valuation story.
Find out about the key risks to this Kelt Exploration narrative.
Another View on Kelt Exploration's Valuation
The high 44.2x P/E suggests Kelt Exploration looks expensive on earnings, yet the SWS DCF model tells a different story. At CA$9.75, the share price sits about 64.6% below an estimated fair value of CA$27.51, which screens as undervalued on this cash flow view. Which signal do you trust more?
Our DCF model can look very different once assumptions around future cash flows, discount rates and commodity prices shift. If you want to understand how those inputs shape the implied fair value here, Look into how the SWS DCF model arrives at its fair value.
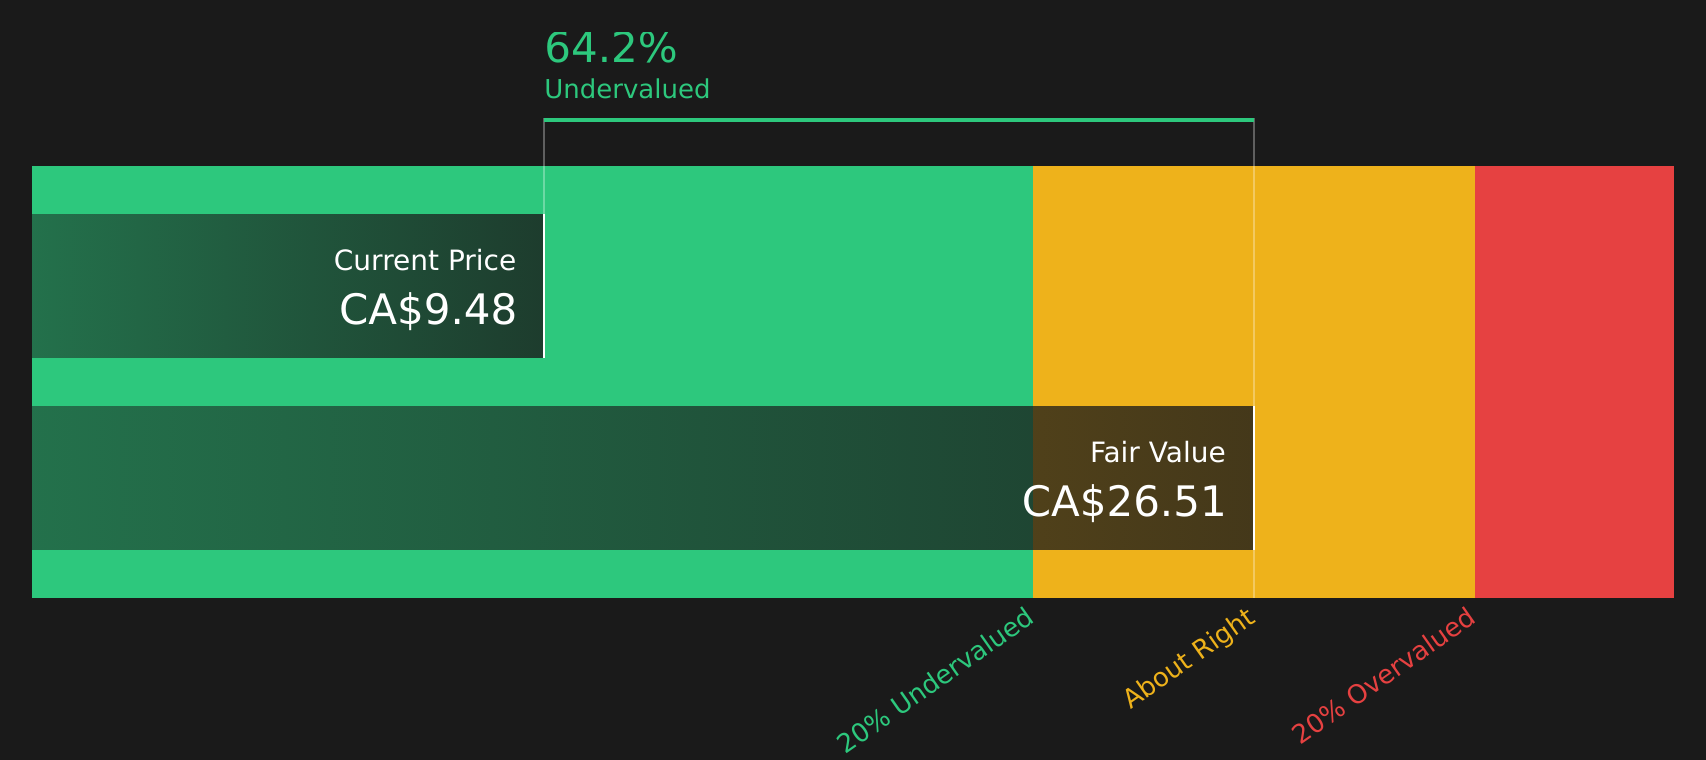
Simply Wall St performs a discounted cash flow (DCF) on every stock in the world every day (check out Kelt Exploration for example). We show the entire calculation in full. You can track the result in your watchlist or portfolio and be alerted when this changes, or use our stock screener to discover 11 high quality undervalued stocks. If you save a screener we even alert you when new companies match - so you never miss a potential opportunity.
Next Steps
Given the mixed signals around Kelt Exploration's valuation and earnings, it makes sense to look at the underlying numbers yourself and reach an informed view. To see what the current optimism is based on and weigh it against your own expectations, review the 2 key rewards
Looking for more investment ideas beyond Kelt Exploration?
Once you have formed a view on Kelt Exploration, it helps to widen your opportunity set so you are not relying on a single stock story.
- Target companies that combine quality and a potential pricing gap by reviewing the 11 high quality undervalued stocks.
- Strengthen your focus on financial resilience by scanning the solid balance sheet and fundamentals stocks screener (11 results).
- Aim to get ahead of the crowd by checking the screener containing 10 high quality undiscovered gems.
Skip waiting for the next headline and start lining up fresh ideas now so you are not scrambling when market conditions shift again.
This article by Simply Wall St is general in nature. We provide commentary based on historical data and analyst forecasts only using an unbiased methodology and our articles are not intended to be financial advice. It does not constitute a recommendation to buy or sell any stock, and does not take account of your objectives, or your financial situation. We aim to bring you long-term focused analysis driven by fundamental data. Note that our analysis may not factor in the latest price-sensitive company announcements or qualitative material. Simply Wall St has no position in any stocks mentioned.
Have feedback on this article? Concerned about the content? Get in touch with us directly. Alternatively, email editorial-team@simplywallst.com