


The United States market has shown robust performance recently, climbing 3.5% in the last 7 days and achieving a 20% increase over the past year, with earnings forecasted to grow by 17% annually. In this favorable environment, selecting dividend stocks like Virginia National Bankshares can be a strategic move for investors seeking steady income alongside potential capital appreciation.
Top 10 Dividend Stocks In The United States
| Name | Dividend Yield | Dividend Rating |
| Peoples Bancorp (PEBO) | 4.08% | ★★★★★☆ |
| OTC Markets Group (OTCM) | 5.28% | ★★★★★★ |
| Huntington Bancshares (HBAN) | 3.57% | ★★★★★☆ |
| Host Hotels & Resorts (HST) | 4.06% | ★★★★★☆ |
| First Interstate BancSystem (FIBK) | 5.02% | ★★★★★★ |
| Ennis (EBF) | 4.50% | ★★★★★★ |
| Columbia Banking System (COLB) | 4.77% | ★★★★★★ |
| Coca-Cola FEMSA. de (KOF) | 4.12% | ★★★★★★ |
| Bladex (BLX) | 4.76% | ★★★★★☆ |
| Accenture (ACN) | 3.81% | ★★★★★☆ |
Click here to see the full list of 92 stocks from our Top US Dividend Stocks screener.
Let's review some notable picks from our screened stocks.
Virginia National Bankshares (VABK)
Simply Wall St Dividend Rating: ★★★★☆☆
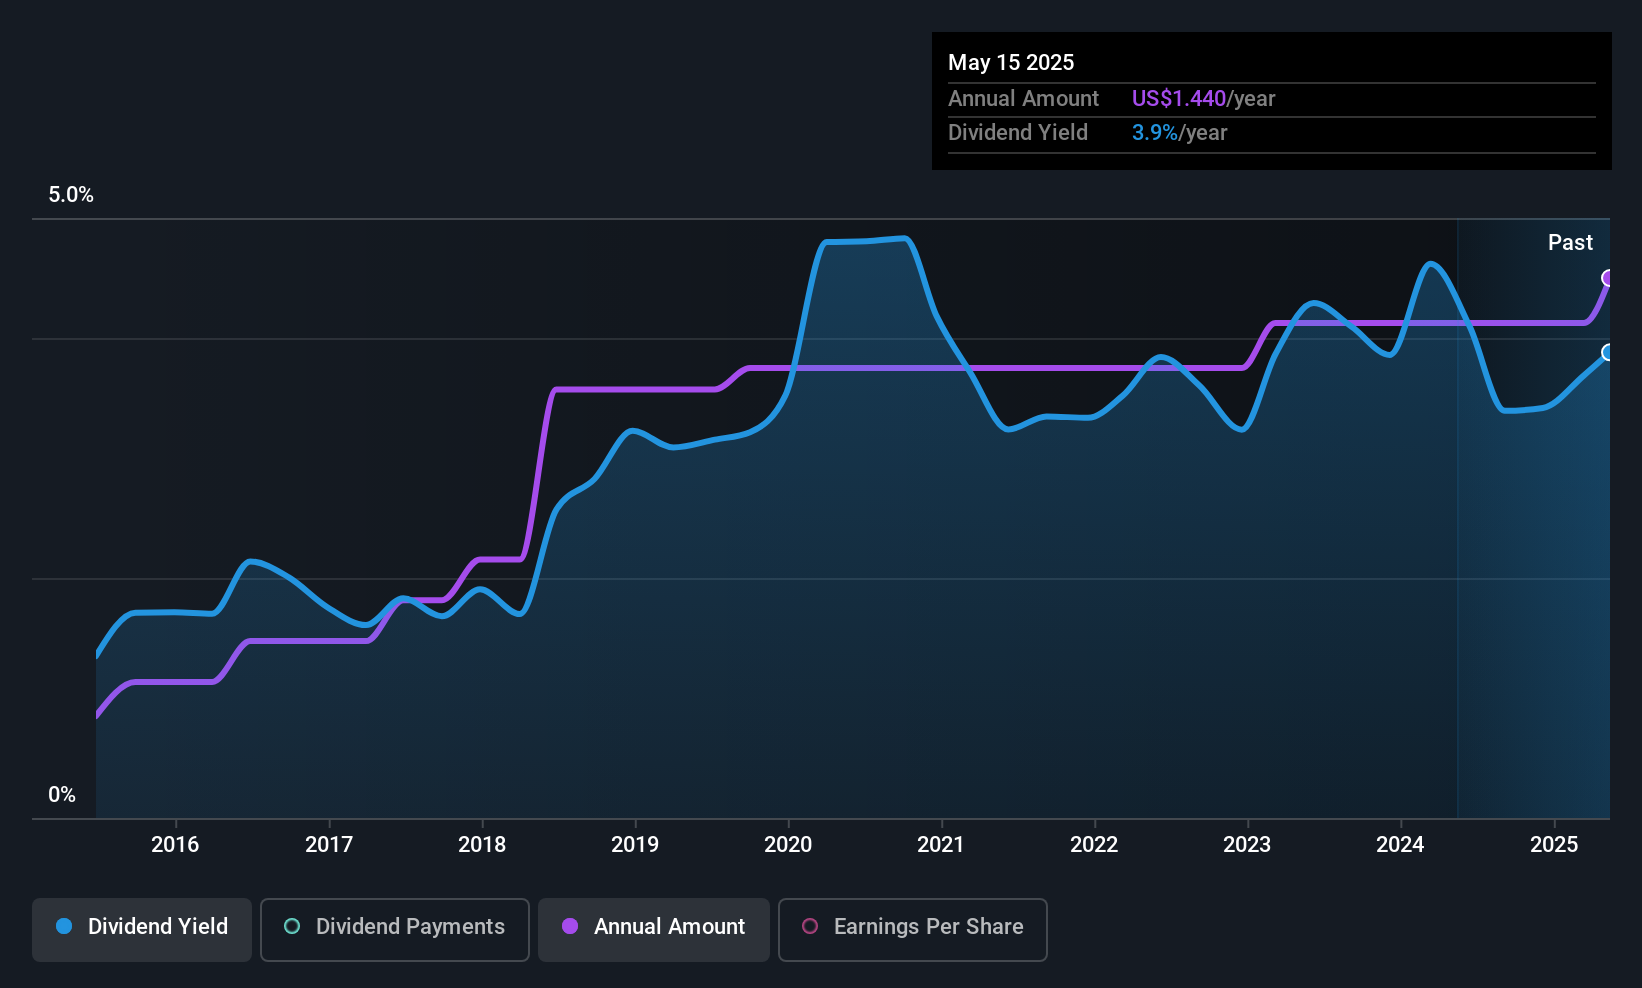
Overview: Virginia National Bankshares Corporation, with a market cap of $258.20 million, serves as the holding company for Virginia National Bank, offering a variety of commercial and retail banking products and services in Virginia.
Operations: Virginia National Bankshares Corporation generates its revenue through a diverse array of commercial and retail banking products and services offered in Virginia.
Dividend Yield: 3.1%
Virginia National Bankshares offers a stable dividend history with payments increasing over the past decade. Its dividends are well-covered by earnings, supported by a low payout ratio of 31.4%. Despite trading at 24.2% below estimated fair value, its dividend yield of 3.07% is lower than the top 25% in the US market. Recent earnings show strong growth, with net income rising to US$9.01 million in Q2 2026 from US$4.24 million a year ago, supporting continued dividend reliability.
- Unlock comprehensive insights into our analysis of Virginia National Bankshares stock in this dividend report.
- Insights from our recent valuation report point to the potential undervaluation of Virginia National Bankshares shares in the market.
General American Investors Company (GAM)
Simply Wall St Dividend Rating: ★★★★☆☆
Overview: General American Investors Company, Inc. is a publicly owned investment manager with a market cap of approximately $1.58 billion.
Operations: General American Investors Company, Inc. generates its revenue primarily from financial services related to closed-end funds, amounting to $24.42 million.
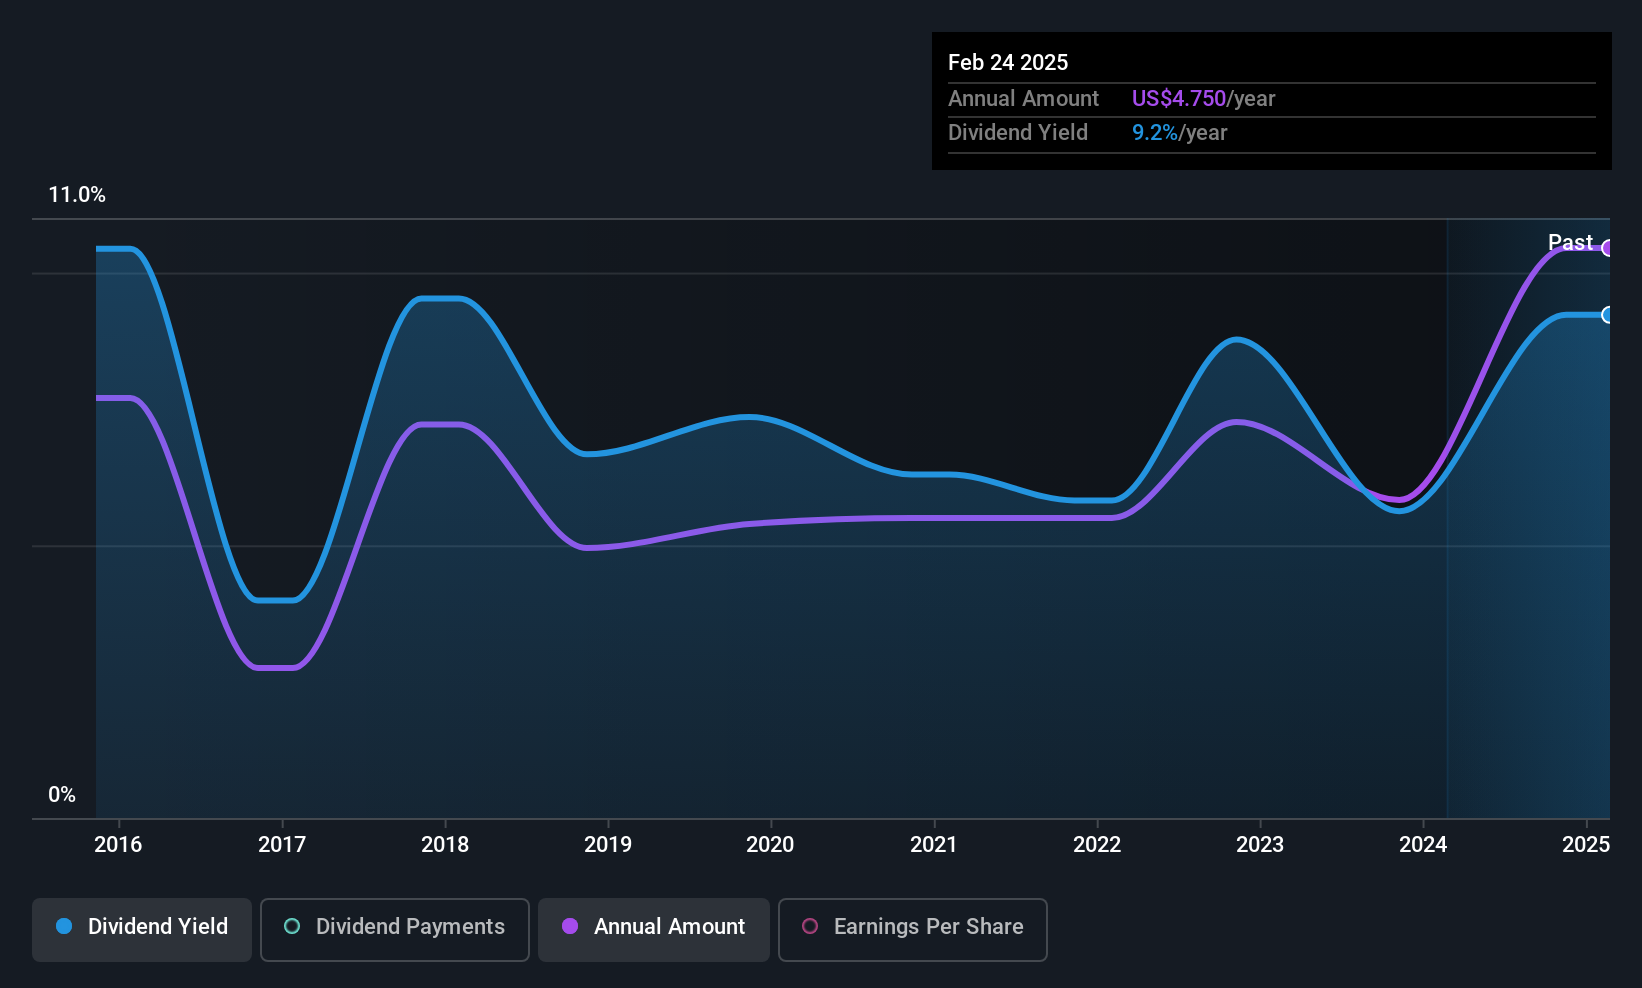
Dividend Yield: 9.6%
General American Investors Company has a high dividend yield, ranking in the top 25% of US dividend payers. However, its dividends have been volatile and unreliable over the past decade. Despite earnings growing by 91.8% last year and a low payout ratio of 41.7%, sustainability concerns persist due to insufficient data on cash flow coverage and large one-off items affecting financial results. The stock trades at 54.4% below estimated fair value, suggesting potential undervaluation despite these risks.
- Get an in-depth perspective on General American Investors Company's performance by reading our dividend report here.
- Our valuation report unveils the possibility General American Investors Company's shares may be trading at a discount.
Ingredion (INGR)
Simply Wall St Dividend Rating: ★★★★★☆
Overview: Ingredion Incorporated manufactures and sells sweeteners, starches, nutrition ingredients, and biomaterial solutions from corn and other starch-based materials to various industries globally, with a market cap of approximately $6.52 billion.
Operations: Ingredion's revenue is primarily derived from its Texture & Healthful Solutions segment, generating $2.50 billion, along with the Food & Industrial Ingredients segments in LATAM and U.S./Canada, contributing $2.41 billion and $2.06 billion respectively.
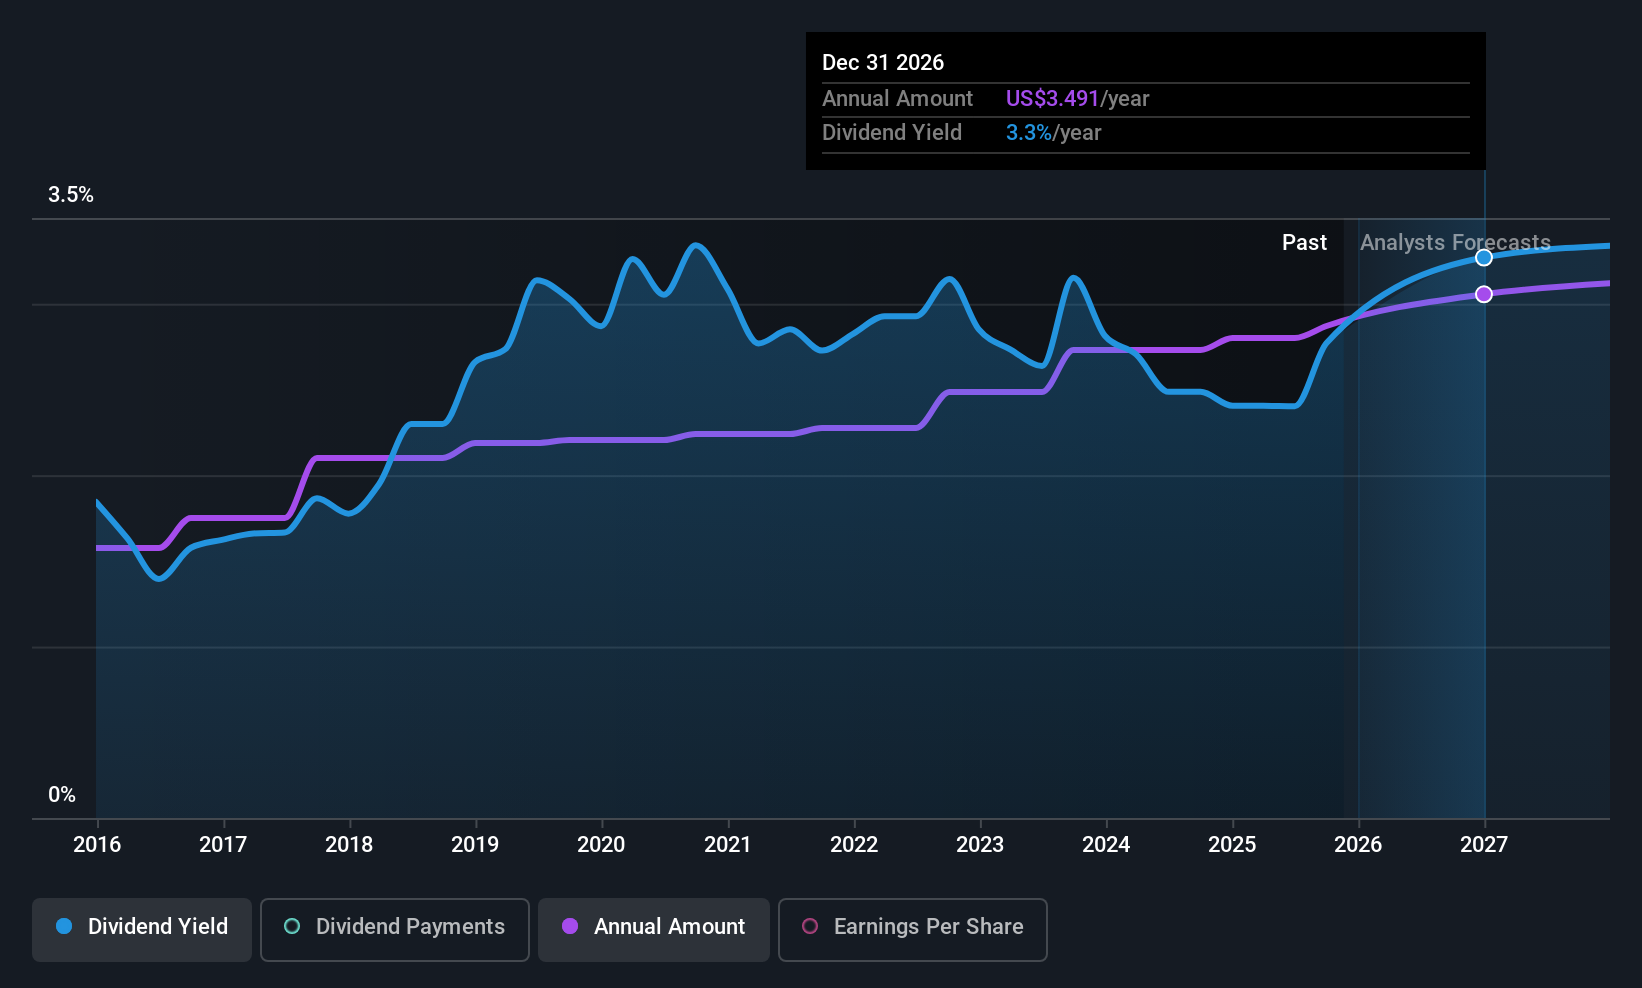
Dividend Yield: 3.2%
Ingredion's dividend payments are well-covered by both earnings and cash flows, with a payout ratio of 35.2% and a cash payout ratio of 58.3%. The company has maintained stable and reliable dividends over the past decade, though its yield of 3.19% is lower than the top US dividend payers. Recent earnings guidance suggests modest sales growth, despite a decline in operating income due to strategic divestments, which may impact future dividend sustainability.
- Navigate through the intricacies of Ingredion with our comprehensive dividend report here.
- In light of our recent valuation report, it seems possible that Ingredion is trading behind its estimated value.
Key Takeaways
- Click this link to deep-dive into the 92 companies within our Top US Dividend Stocks screener.
- Are these companies part of your investment strategy? Use Simply Wall St to consolidate your holdings into a portfolio and gain insights with our comprehensive analysis tools.
- Enhance your investing ability with the Simply Wall St app and enjoy free access to essential market intelligence spanning every continent.
Ready For A Different Approach?
- Explore high-performing small cap companies that haven't yet garnered significant analyst attention.
- Fuel your portfolio with companies showing strong growth potential, backed by optimistic outlooks both from analysts and management.
- Find companies with promising cash flow potential yet trading below their fair value.
This article by Simply Wall St is general in nature. We provide commentary based on historical data and analyst forecasts only using an unbiased methodology and our articles are not intended to be financial advice. It does not constitute a recommendation to buy or sell any stock, and does not take account of your objectives, or your financial situation. We aim to bring you long-term focused analysis driven by fundamental data. Note that our analysis may not factor in the latest price-sensitive company announcements or qualitative material. Simply Wall St has no position in any stocks mentioned.
Have feedback on this article? Concerned about the content? Get in touch with us directly. Alternatively, email editorial-team@simplywallst.com