


- In the second quarter of 2026, Dave Inc. reported revenue of US$170.79 million, net income of US$6.69 million, and lower earnings per share than a year earlier, while for the first half it delivered US$329.21 million in revenue and US$64.62 million in net income and raised full‑year GAAP operating revenue guidance to US$725 million–US$735 million.
- Alongside these results, Dave completed a share repurchase of 992,232 shares for US$205.85 million and highlighted growth drivers such as CashAI upgrades, higher ExtraCash limits, and expanding member acquisition supported by a new US$225 million funding facility.
- We’ll now examine how the upgraded 2026 revenue guidance and improving member metrics feed into Dave’s existing investment narrative and assumptions.
AI is about to change healthcare. These 43 stocks are working on everything from early diagnostics to drug discovery. The best part - they are all under $10b in market cap - there's still time to get in early.
Dave Investment Narrative Recap
To own Dave, you have to believe that its ExtraCash advances, CashAI underwriting and neobank features can keep attracting and monetizing members without triggering regulatory or credit issues. The raised 2026 revenue outlook and ongoing member growth support that near term revenue catalyst, but the latest quarter’s lower EPS underlines that profitability is still the key swing factor. For now, this earnings mix does not fundamentally change the biggest immediate risk around tighter rules on small dollar, fee based products.
The most directly relevant update here is the completed repurchase of 992,232 shares for US$205.85 million, roughly 7.36% of the share count. That move, alongside the higher revenue guidance to US$725 million to US$735 million, sharpens the focus on how efficiently Dave can convert member and ExtraCash growth into durable earnings, since a smaller share base only helps if underlying profitability holds up against rising marketing, funding and compliance demands.
Yet even with higher guidance and buybacks, the risk that tougher regulation could reshape Dave’s fee based model is something investors should be aware of...
Read the full narrative on Dave (it's free!)
Dave's narrative projects $1.1 billion revenue and $341.6 million earnings by 2029. This requires 21.6% yearly revenue growth and about a $116.6 million earnings increase from $225.0 million today.
Uncover how Dave's forecasts yield a $388.55 fair value, a 22% upside to its current price.
Exploring Other Perspectives
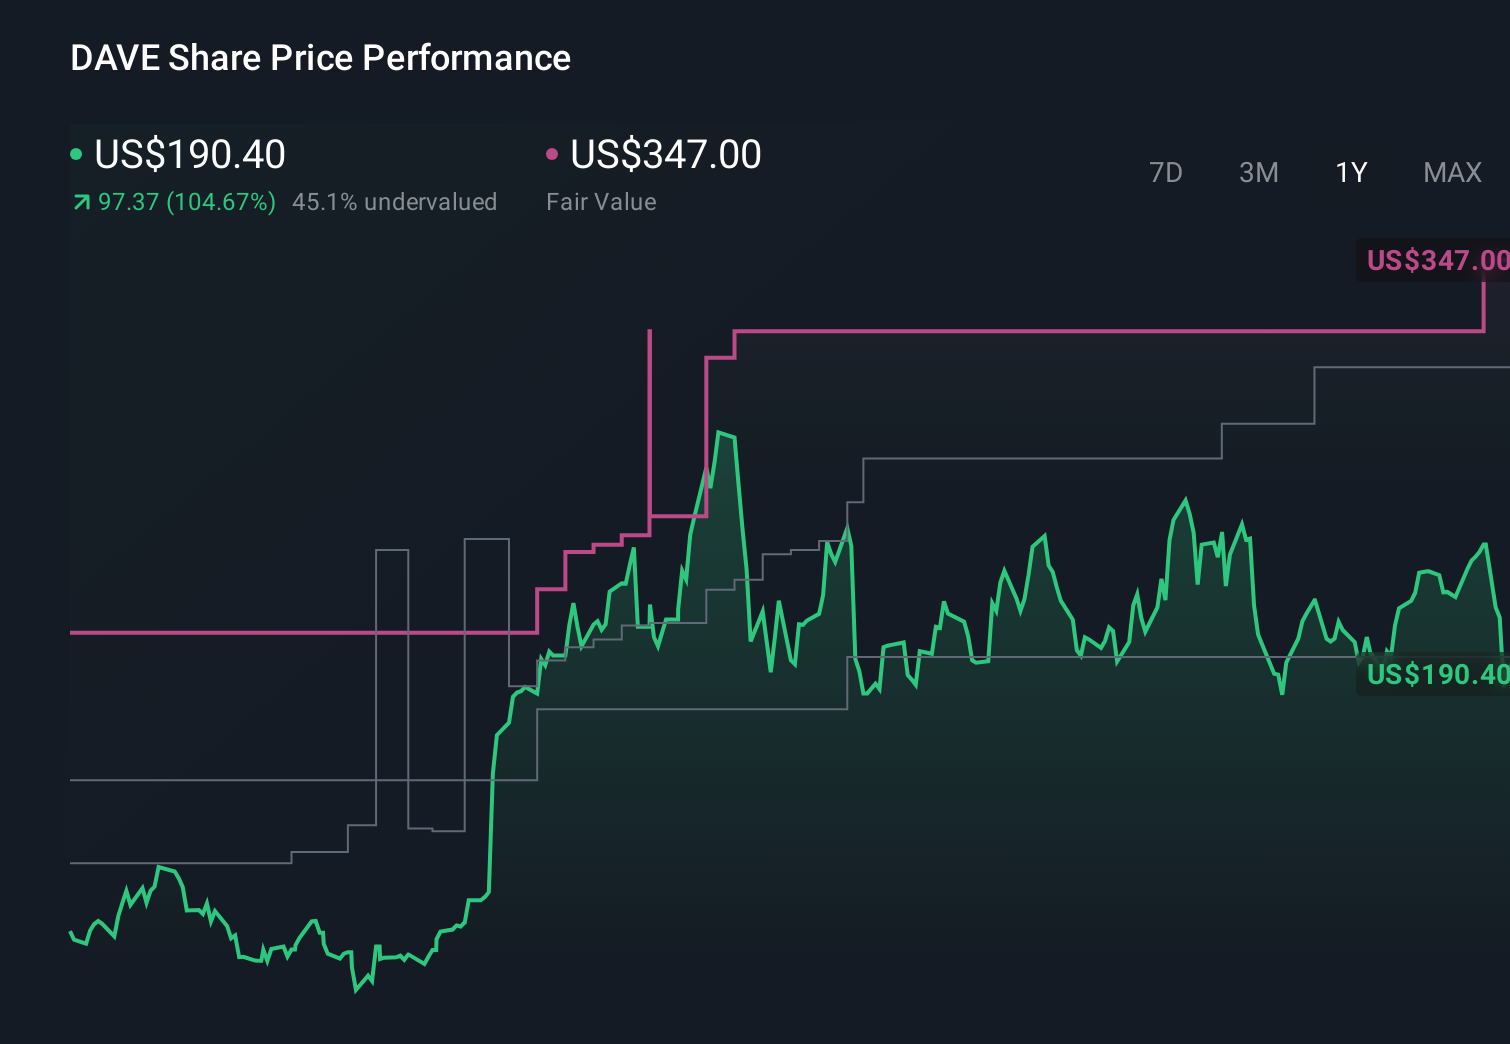
While consensus leans on continued member and revenue growth, the lowest estimate analysts were already assuming about US$1.1 billion of 2029 revenue and US$389.7 million of earnings, yet still saw tighter regulation and higher marketing dependence as real threats, reminding you that reasonable people can look at the same results and reach very different conclusions.
Explore 5 other fair value estimates on Dave - why the stock might be worth 18% less than the current price!
Form Your Own Verdict
Don't just follow the ticker - dig into the data and build a conviction that's truly your own.
- A great starting point for your Dave research is our analysis highlighting 3 key rewards and 1 important warning sign that could impact your investment decision.
- Our free Dave research report provides a comprehensive fundamental analysis summarized in a single visual - the Snowflake - making it easy to evaluate Dave's overall financial health at a glance.
Looking For Alternative Opportunities?
Right now could be the best entry point. These picks are fresh from our daily scans. Don't delay:
- Find 51 companies with promising cash flow potential yet trading below their fair value.
- The future of work is here. Discover the 36 top robotics and automation stocks leading the charge in AI-driven automation and industrial transformation.
- We've uncovered the 8 dividend fortresses yielding 5%+ that don't just survive market storms, but thrive in them.
This article by Simply Wall St is general in nature. We provide commentary based on historical data and analyst forecasts only using an unbiased methodology and our articles are not intended to be financial advice. It does not constitute a recommendation to buy or sell any stock, and does not take account of your objectives, or your financial situation. We aim to bring you long-term focused analysis driven by fundamental data. Note that our analysis may not factor in the latest price-sensitive company announcements or qualitative material. Simply Wall St has no position in any stocks mentioned.
Have feedback on this article? Concerned about the content? Get in touch with us directly. Alternatively, email editorial-team@simplywallst.com