


TOKAI Holdings (TSE:3167) has drawn fresh attention after announcing a share repurchase program of up to 5,000,000 shares for ¥5,000 million, alongside updated dividend guidance and first quarter fiscal 2027 results.
See our latest analysis for TOKAI Holdings.
The buyback and dividend guidance sit against a backdrop of firm momentum in TOKAI Holdings, with a 7.6% 30 day share price return and a 63.8% five year total shareholder return pointing to interest that has built over time rather than faded recently.
If this kind of shareholder focused update has you thinking about where else capital might work hard, it could be worth scanning for infrastructure heavy power and utilities peers, or checking out 37 power grid technology and infrastructure stocks
TOKAI Holdings now has a buyback on the table, fresh dividend guidance and recent earnings in view. Does that make buying at the current price sensible, or is it worth waiting to see how the valuation stacks up next?
Preferred P/E of 14.1x: Is it justified for TOKAI Holdings?
The SWS DCF model estimates a fair value for TOKAI Holdings of ¥2,601.92, compared with a last close of ¥1,236. The stock is described as trading at a 52.5% discount to this estimate, which frames the current debate about whether the share price reflects its future cash flow potential.
The DCF approach projects TOKAI Holdings' future cash flows and then discounts them back to today using a required rate of return. That puts the focus on the durability of its earnings and cash generation rather than short term sentiment or headline multiples.
In the context of TOKAI Holdings' profile as a diversified energy and communications services group, that cash flow lens matters. Earnings have grown by 8% per year over the past 5 years, with earnings forecast to grow 8.45% per year and net profit margins reported at 4.6%. Those inputs, combined with the company's capital structure and sector profile, feed directly into the SWS DCF model's outcome for fair value.
Look into how the SWS DCF model arrives at its fair value.
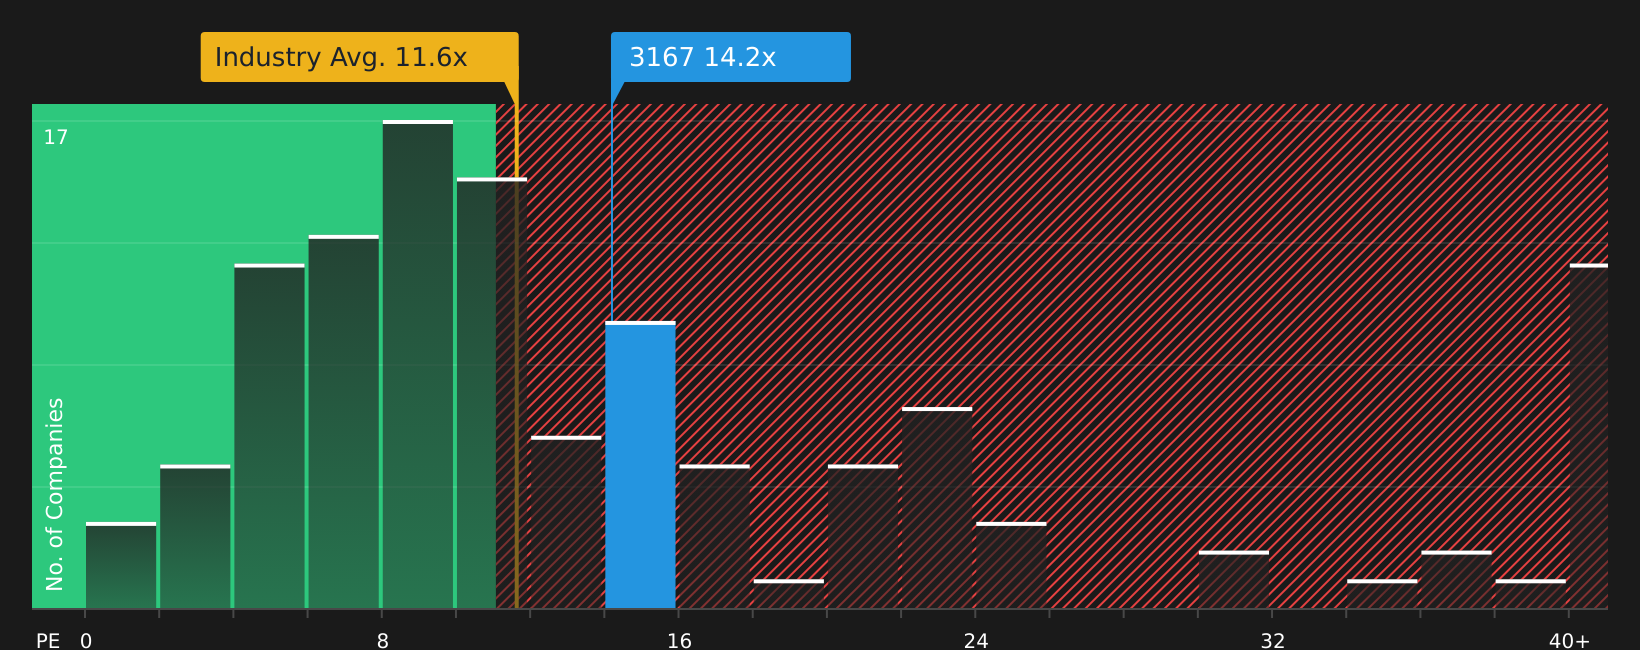
At the same time, TOKAI Holdings trades on a P/E of 14.1x, which is flagged as expensive relative to both the Asian Industrials industry average of 11.4x and a peer average of 12.7x. That suggests the market is assigning a higher earnings multiple than many comparable companies, even though DCF analysis points to a large gap between price and estimated cash flow value.
The P/E ratio compares the current share price to earnings per share. For a mature infrastructure and services focused business like TOKAI Holdings, investors often use it as a shorthand for how much they are paying for each unit of current earnings. A higher P/E can signal expectations for steadier cash generation or a higher quality earnings mix, although it can also point to overpayment if those expectations do not line up with underlying fundamentals.
Here, the SWS checks flag that TOKAI Holdings' P/E of 14.1x is not only above industry and peer averages, it is also above an estimated fair P/E of 13.2x. That fair ratio is presented as a level the market could move towards if pricing and fundamentals realign, which would imply less room for multiple expansion from current levels and more focus on how earnings and cash flows evolve.
Explore the SWS fair ratio for TOKAI Holdings
Result: Price-to-earnings of 14.1x (OVERVALUED)
However, investors in TOKAI Holdings still need to weigh execution risks in its broad service mix, as well as the possibility that earnings or cash generation fall short of current expectations.
Find out about the key risks to this TOKAI Holdings narrative.
Another view on TOKAI Holdings’ valuation
While the SWS DCF model frames TOKAI Holdings as undervalued based on future cash flows, the earnings multiple tells a different story. A P/E of 14.1x sits above the Asian Industrials average of 11.4x, the peer average of 12.7x, and even a fair ratio of 13.2x.
This gap points to less of a clear cut bargain on current earnings and more of a trade off between paying up today and backing the cash flow profile implied by the DCF work. Which yardstick do you trust more for TOKAI Holdings at this point in the cycle?
See what the numbers say about this price — find out in our valuation breakdown.
Simply Wall St performs a discounted cash flow (DCF) on every stock in the world every day (check out TOKAI Holdings for example). We show the entire calculation in full. You can track the result in your watchlist or portfolio and be alerted when this changes, or use our stock screener to discover 19 high quality undervalued stocks. If you save a screener we even alert you when new companies match - so you never miss a potential opportunity.
Next Steps
With mixed signals around valuation and sentiment on TOKAI Holdings, it may be helpful to look past the headlines and review the underlying data yourself. To weigh both the concerns and the potential upside before you act, take a closer look at the 4 key rewards and 1 important warning sign.
Looking for more investment ideas beyond TOKAI Holdings?
If you want a broader view than TOKAI Holdings alone, the Simply Wall Street Screener can help you quickly spot other stocks that may fit your style.
- Spot potential value opportunities early and compare them with TOKAI Holdings by checking out the 19 high quality undervalued stocks before others catch on.
- Strengthen the stability of your watchlist by reviewing the solid balance sheet and fundamentals stocks screener (40 results) and see which businesses pair financial resilience with dependable fundamentals.
- Unearth lesser known prospects that might complement a position in TOKAI Holdings by scanning the screener containing 65 high quality undiscovered gems while they are still off most investors' radar.
This article by Simply Wall St is general in nature. We provide commentary based on historical data and analyst forecasts only using an unbiased methodology and our articles are not intended to be financial advice. It does not constitute a recommendation to buy or sell any stock, and does not take account of your objectives, or your financial situation. We aim to bring you long-term focused analysis driven by fundamental data. Note that our analysis may not factor in the latest price-sensitive company announcements or qualitative material. Simply Wall St has no position in any stocks mentioned.
Have feedback on this article? Concerned about the content? Get in touch with us directly. Alternatively, email editorial-team@simplywallst.com