


Sharp (TSE:6753) just held its Q1 2027 earnings call on 7 August 2026, giving investors fresh information on recent performance and management commentary that can influence how the stock is assessed.
See our latest analysis for Sharp.
Following the Q1 2027 earnings call and the board meeting on 7 August 2026 about reorganising wholly owned subsidiaries, Sharp's 1 day share price return of 1.10% and 90 day share price return of 9.65% sit against a year to date share price decline of 18.26% and a 1 year total shareholder return decline of 15.56%. This points to some short term momentum after a weaker multi year period where the 5 year total shareholder return declined 55.75%.
If you are reassessing Sharp after these results, it can also help to widen the lens and see what else is moving by checking out 37 power grid technology and infrastructure stocks
Bulls point to Sharp’s recent share price rebound and positive net income trend. Bears focus on the multi year shareholder losses and soft revenue. Which side do the current valuation numbers lean toward next?
Price-to-Earnings of 18.1x: Is it justified?
On the latest figures, Sharp trades on a P/E of 18.1x, which prices the recent ¥650 close as more expensive than both its industry and peer averages.
The P/E ratio compares the current share price with earnings per share. For a company like Sharp in the consumer durables sector, this multiple often reflects how the market weighs current profitability against expectations for future earnings.
In this case, several data points pull in different directions. Earnings growth is forecast at 11.31% per year, yet reported earnings over the past year declined 50.8% and recent profit margins slipped from 2.3% to 1.3%. The current multiple of 18.1x is higher than the JP Consumer Durables industry average of 9.8x and above the peer average of 17.7x. It also sits above an estimated fair P/E of 16.8x, a level the market could potentially move toward if expectations moderate.
Explore the SWS fair ratio for Sharp
Result: Price-to-Earnings of 18.1x (OVERVALUED)
However, the P/E discussion sits against revenue that declined 2.8% over the year and a five-year total shareholder return that fell 55.75%, which could pressure sentiment.
Find out about the key risks to this Sharp narrative.
Another view on Sharp using the SWS DCF model
The P/E analysis suggests Sharp looks expensive. However, the SWS DCF model values the stock at about ¥630.96 per share, compared with the current ¥650 price. That points to a smaller degree of overvaluation. How much weight do you place on cash flow forecasts versus earnings multiples?
Look into how the SWS DCF model arrives at its fair value.
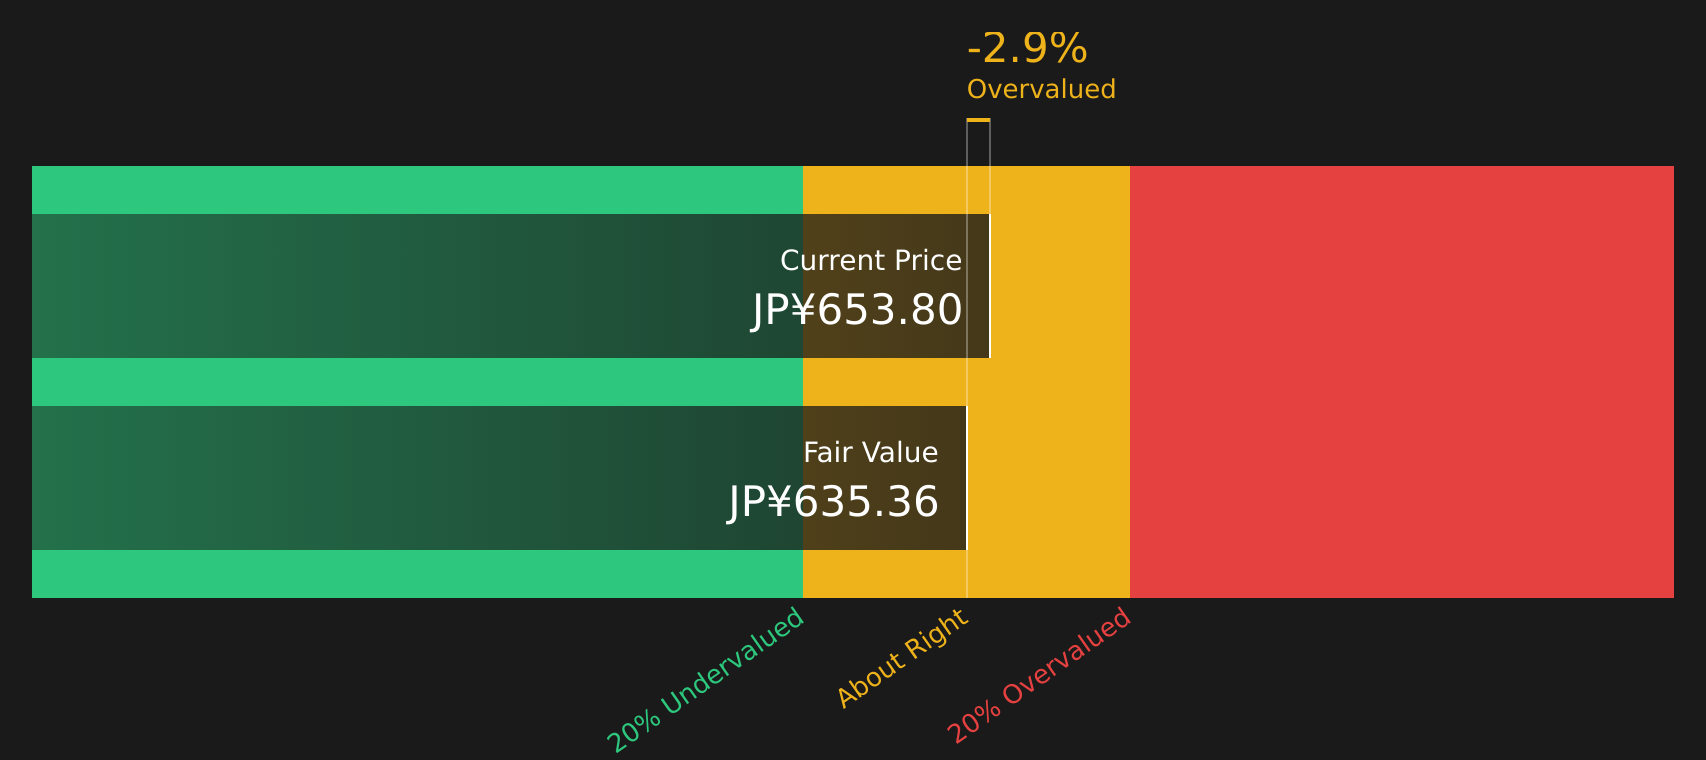
Simply Wall St performs a discounted cash flow (DCF) on every stock in the world every day (check out Sharp for example). We show the entire calculation in full. You can track the result in your watchlist or portfolio and be alerted when this changes, or use our stock screener to discover 19 high quality undervalued stocks. If you save a screener we even alert you when new companies match - so you never miss a potential opportunity.
Next Steps
The mix of concerns and optimism around Sharp will mean different things to different investors, so it helps to review the numbers and commentary directly and decide what matters most for your own approach. To see both sides in one place, start with the 1 key reward and 3 important warning signs.
Looking for more investment ideas beyond Sharp?
If Sharp's latest update has you thinking harder about where to put fresh capital next, it can pay to line up a few high quality alternatives.
- Start broad and hunt for quality by reviewing companies highlighted in the 19 high quality undervalued stocks so you are not just relying on a single stock story.
- Prioritise resilience by checking companies in the 55 resilient stocks with low risk scores which focus on steadier fundamentals that can help smooth out portfolio swings.
- Target financial strength by scanning the solid balance sheet and fundamentals stocks screener (40 results) and avoid missing businesses that pair healthier balance sheets with solid operating profiles.
This article by Simply Wall St is general in nature. We provide commentary based on historical data and analyst forecasts only using an unbiased methodology and our articles are not intended to be financial advice. It does not constitute a recommendation to buy or sell any stock, and does not take account of your objectives, or your financial situation. We aim to bring you long-term focused analysis driven by fundamental data. Note that our analysis may not factor in the latest price-sensitive company announcements or qualitative material. Simply Wall St has no position in any stocks mentioned.
Have feedback on this article? Concerned about the content? Get in touch with us directly. Alternatively, email editorial-team@simplywallst.com