


Airbus stock has more than doubled over the past five years, yet the current valuation checks still point to the shares trading below an estimate of intrinsic value. The Discounted Cash Flow (DCF) view and the market multiple read both lean toward Airbus looking inexpensive relative to those fundamentals.
- Airbus has returned 105.0% over the past five years, which puts recent price action on top of a strong long term gain that investors need to weigh against today’s valuation signals.
- Robust aircraft orders and defence activity can support confidence in future cash flows. At the same time, the recent cockpit safety concerns around certain Airbus aircraft families highlight operational and regulatory risk that may affect how the market prices the stock.
- With a high value score of 5 out of 6, the broader checks lean toward Airbus being undervalued rather than expensive on key metrics.
The issue now is whether the current share price, at €213.65, still offers a reasonable margin against the intrinsic value estimate that screens Airbus as undervalued by 21.2%.
Is Airbus a Bargain on Cash Flow?
The Discounted Cash Flow (DCF) model estimates what Airbus might be worth based on its future cash generation. For Airbus, the latest twelve month free cash flow sits at about €4.8b, and the model assumes that free cash flow grows from this base rather than shrinking.
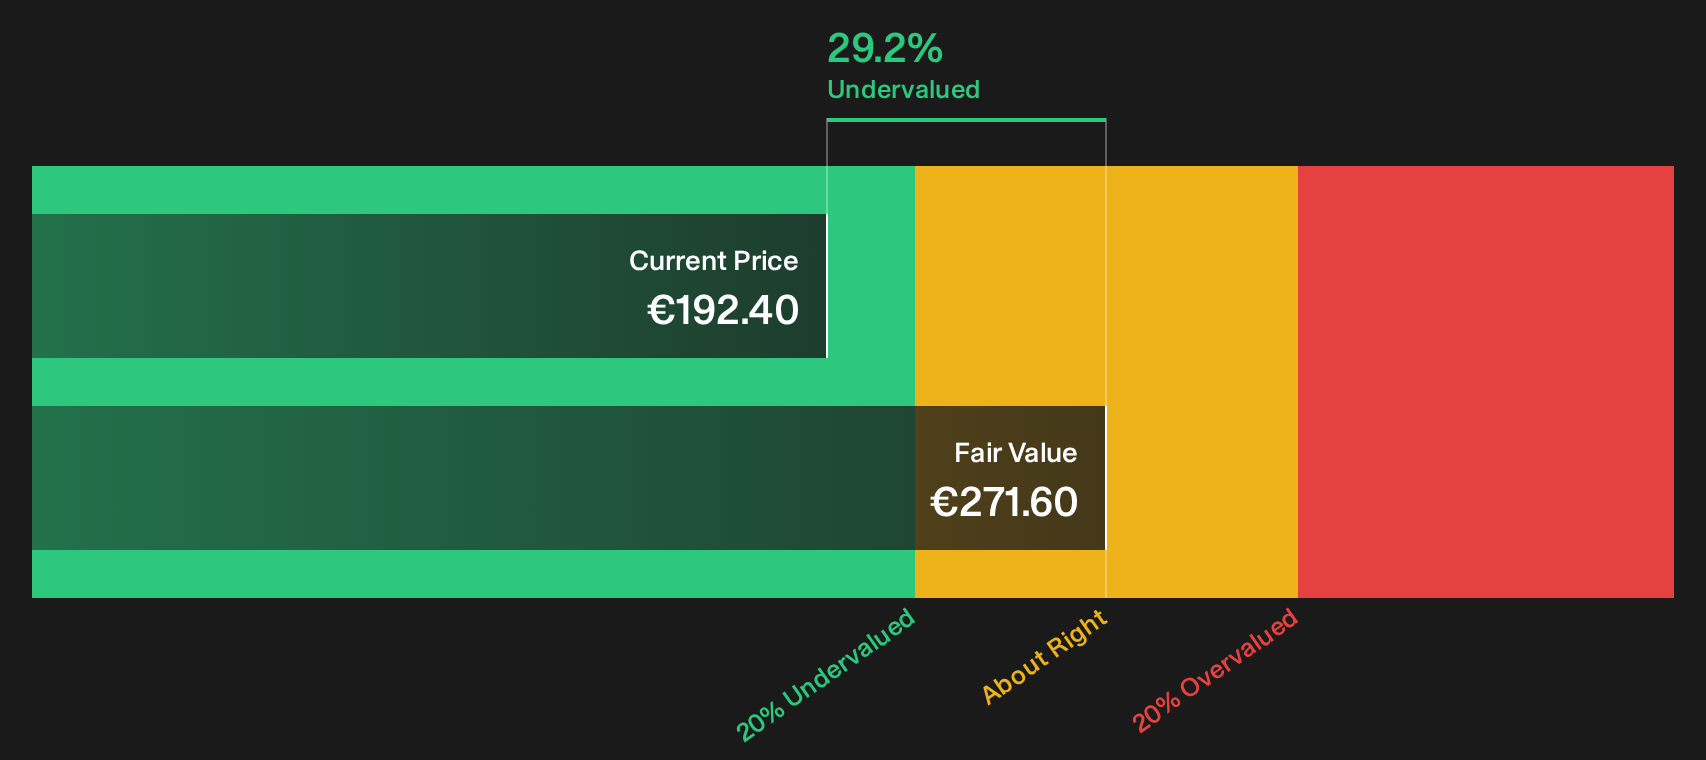
On those cash flow projections, the DCF points to an intrinsic value of around €271 per share, compared with the current price of €213.65. That gap implies the stock is about 21.2% undervalued on this cash flow view. The recent cockpit safety concerns flagged by pilots and regulators help explain why the market price may still sit below what the current cash flow profile and order momentum support.
Overall, the Discounted Cash Flow view suggests Airbus stock currently screens as undervalued relative to its estimated intrinsic value.
Our Discounted Cash Flow (DCF) analysis suggests Airbus is undervalued by 21.2%. Track this in your watchlist or portfolio, or discover 261 more high quality undervalued stocks.
Is Airbus Still Cheap on Earnings?
The P/E ratio is a useful cross check for Airbus because earnings are a key focus for many investors in the Aerospace & Defense sector. At a current P/E of 28.5x, Airbus trades below the peer group average of 33.4x and below the broader Aerospace & Defense industry average of 45.2x. This indicates that the stock is priced at a discount relative to many listed competitors on reported earnings.
The tailored fair P/E ratio for Airbus is 33.6x. This measure incorporates factors such as Airbus' margins, size and risk profile rather than relying only on simple averages. Compared with the current 28.5x multiple, the gap indicates that the market is applying a more cautious earnings multiple than this framework suggests.
On this P/E measure, Airbus stock currently appears undervalued relative to where its earnings multiple might reasonably sit.

See what the numbers say about this price — find out in our valuation breakdown.
The Airbus Narrative: What Would Justify Today's Price?
Simply Wall St Narratives pick up where the Airbus valuation puzzle leaves off and spell out what specific growth, margin and earnings paths would need to hold for the stock to be worth materially more or materially less than today’s price. Each Airbus narrative on the Community page ties its number to a clear view on how growth, profitability and key risks could evolve, which you can revisit as fresh information comes through.
Community views on Airbus sit far apart, with some investors focused on the duopoly strength and others fixated on climate, cost and execution risk.
Bull case: 8% undervalued
"Airbus began as a political compromise. It evolved into an industrial champion. Today, it stands at the intersection of technology, geopolitics, and long-term global mobility…"
Read the full Bull Case to see why Airbus could be undervalued
Bear case: 22% overvalued
"Tightening climate regulations and green technology challenges threaten future revenue growth, profitability, and margin improvement prospects…"
Read the full Bear Case to see why Airbus could be overvalued
Do you think there's more to the story for Airbus? Head over to our Community to see what others are saying!
The Bottom Line
For Airbus, both the Discounted Cash Flow (DCF) intrinsic value estimate and the earnings multiple view point in the same direction. The stock screens as undervalued on cash flow assumptions and trades at a discount to sector P/E benchmarks. The key question is whether current aircraft demand, defence activity and cash generation can be maintained in the face of safety and execution risks. The crux of the bull versus bear debate is whether that discount reflects a genuine opportunity in Airbus or a market that is correctly pricing in those operational and regulatory uncertainties.
This article by Simply Wall St is general in nature. We provide commentary based on historical data and analyst forecasts only using an unbiased methodology and our articles are not intended to be financial advice. It does not constitute a recommendation to buy or sell any stock, and does not take account of your objectives, or your financial situation. We aim to bring you long-term focused analysis driven by fundamental data. Note that our analysis may not factor in the latest price-sensitive company announcements or qualitative material. Simply Wall St has no position in any stocks mentioned.
Have feedback on this article? Concerned about the content? Get in touch with us directly. Alternatively, email editorial-team@simplywallst.com