


As global markets navigate a complex landscape marked by geopolitical developments and economic shifts, Asia's stock markets have shown resilience, with indices like Japan's Nikkei 225 and China's Shanghai Composite posting gains. In this environment, dividend stocks continue to attract attention for their potential to provide steady income streams amidst market volatility. When considering dividend stocks in Asia, investors often look for companies with strong fundamentals and consistent payout histories that can weather the current economic climate.
Top 10 Dividend Stocks In Asia
| Name | Dividend Yield | Dividend Rating |
| Sakai Moving ServiceLtd (TSE:9039) | 3.96% | ★★★★★★ |
| OUG Holdings (TSE:8041) | 3.88% | ★★★★★★ |
| Nippon Carbon (TSE:5302) | 4.01% | ★★★★★★ |
| Kumagai GumiLtd (TSE:1861) | 3.88% | ★★★★★★ |
| HUAYU Automotive Systems (SHSE:600741) | 6.32% | ★★★★★★ |
| Guangxi LiuYao Group (SHSE:603368) | 4.26% | ★★★★★★ |
| GakkyushaLtd (TSE:9769) | 4.76% | ★★★★★★ |
| Changjiang Publishing & MediaLtd (SHSE:600757) | 5.32% | ★★★★★★ |
| Business Brain Showa-Ota (TSE:9658) | 4.46% | ★★★★★★ |
| Binggrae (KOSE:A005180) | 4.72% | ★★★★★★ |
Click here to see the full list of 1025 stocks from our Top Asian Dividend Stocks screener.
Underneath we present a selection of stocks filtered out by our screen.
King Chou Marine Technology (TPEX:4417)
Simply Wall St Dividend Rating: ★★★★★☆
Overview: King Chou Marine Technology Co., Ltd. is engaged in the manufacturing, processing, exporting, and importing of fishing nets, twines, and ropes across Asia, Europe, the United States, and internationally with a market cap of NT$4.04 billion.
Operations: King Chou Marine Technology Co., Ltd. generates its revenue through the production and international trade of fishing nets, twines, and ropes.
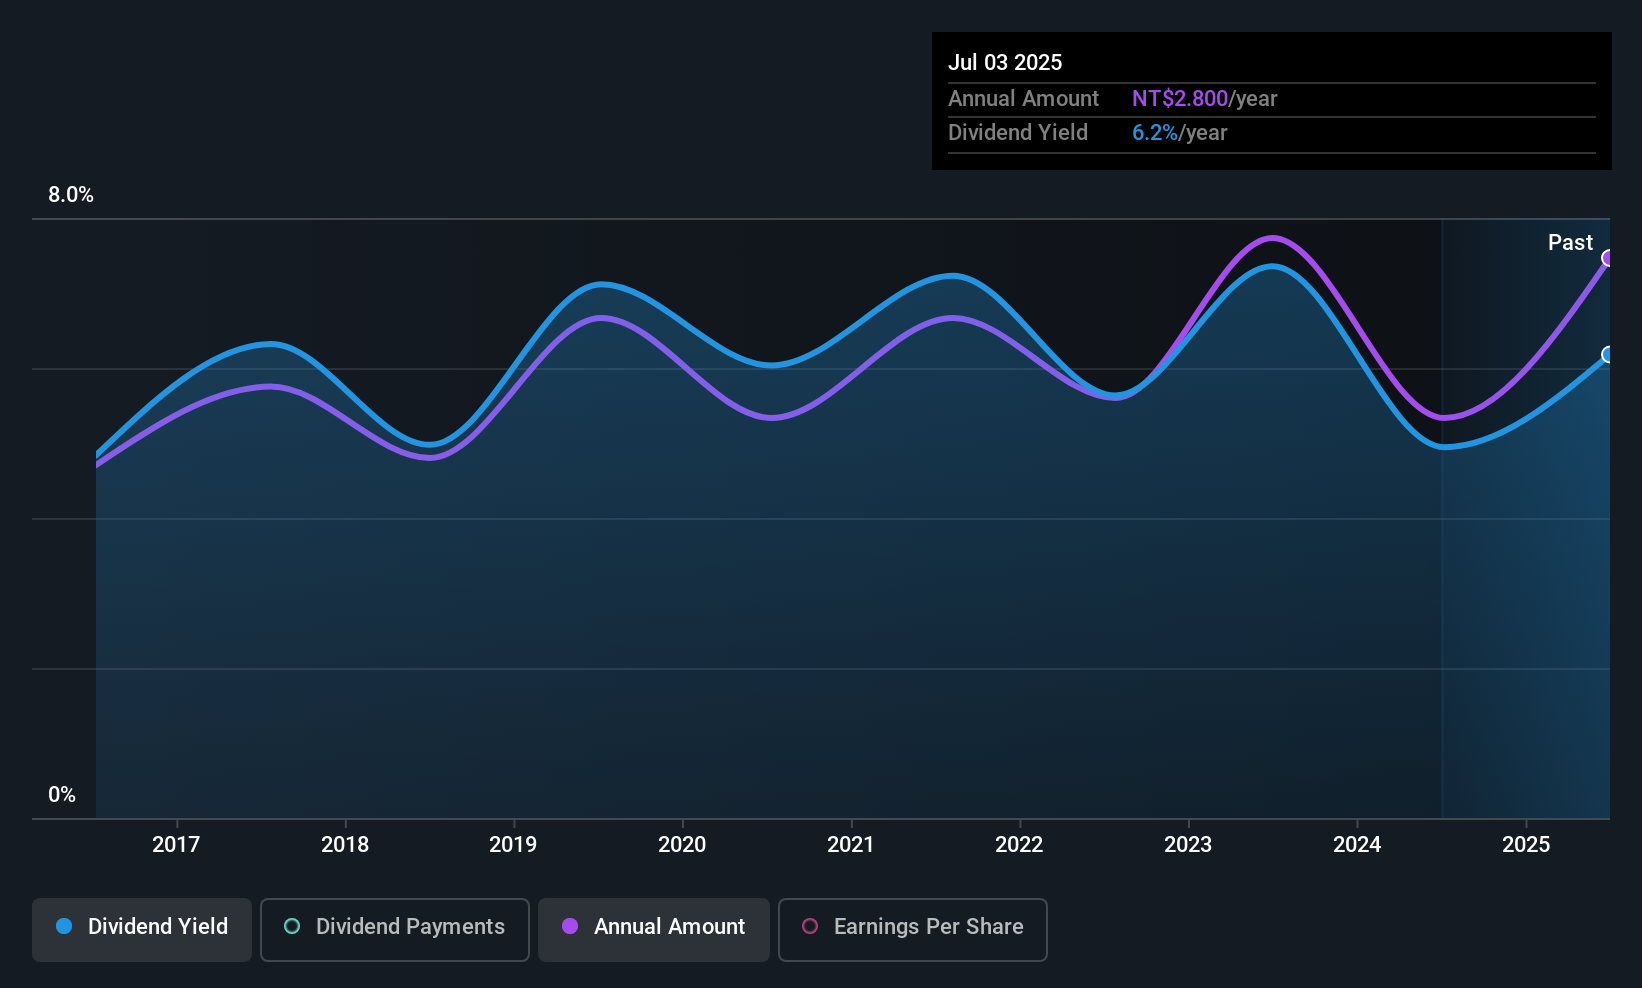
Dividend Yield: 6.9%
King Chou Marine Technology offers a compelling dividend yield of 6.86%, placing it in the top 25% of Taiwan's market. Despite its attractive price-to-earnings ratio of 9.2x, below the market average, the company's dividends have been volatile over the past decade. However, they remain covered by earnings with a payout ratio of 56.7% and cash flows at an 81.9% cash payout ratio, suggesting sustainability amidst fluctuating net income figures reported recently.
- Get an in-depth perspective on King Chou Marine Technology's performance by reading our dividend report here.
- The analysis detailed in our King Chou Marine Technology valuation report hints at an inflated share price compared to its estimated value.
TOKAI Holdings (TSE:3167)
Simply Wall St Dividend Rating: ★★★★★☆
Overview: TOKAI Holdings Corporation operates in the energy, information and communications sectors both in Japan and internationally, with a market cap of ¥158.29 billion.
Operations: TOKAI Holdings Corporation generates revenue primarily from its Energy segment at ¥103.82 billion, Information and Communications at ¥68.06 billion, CATV at ¥37.89 billion, and Construction, Equipment and Real Estate at ¥27.90 billion, with additional contributions from Aqua amounting to ¥10.42 billion.
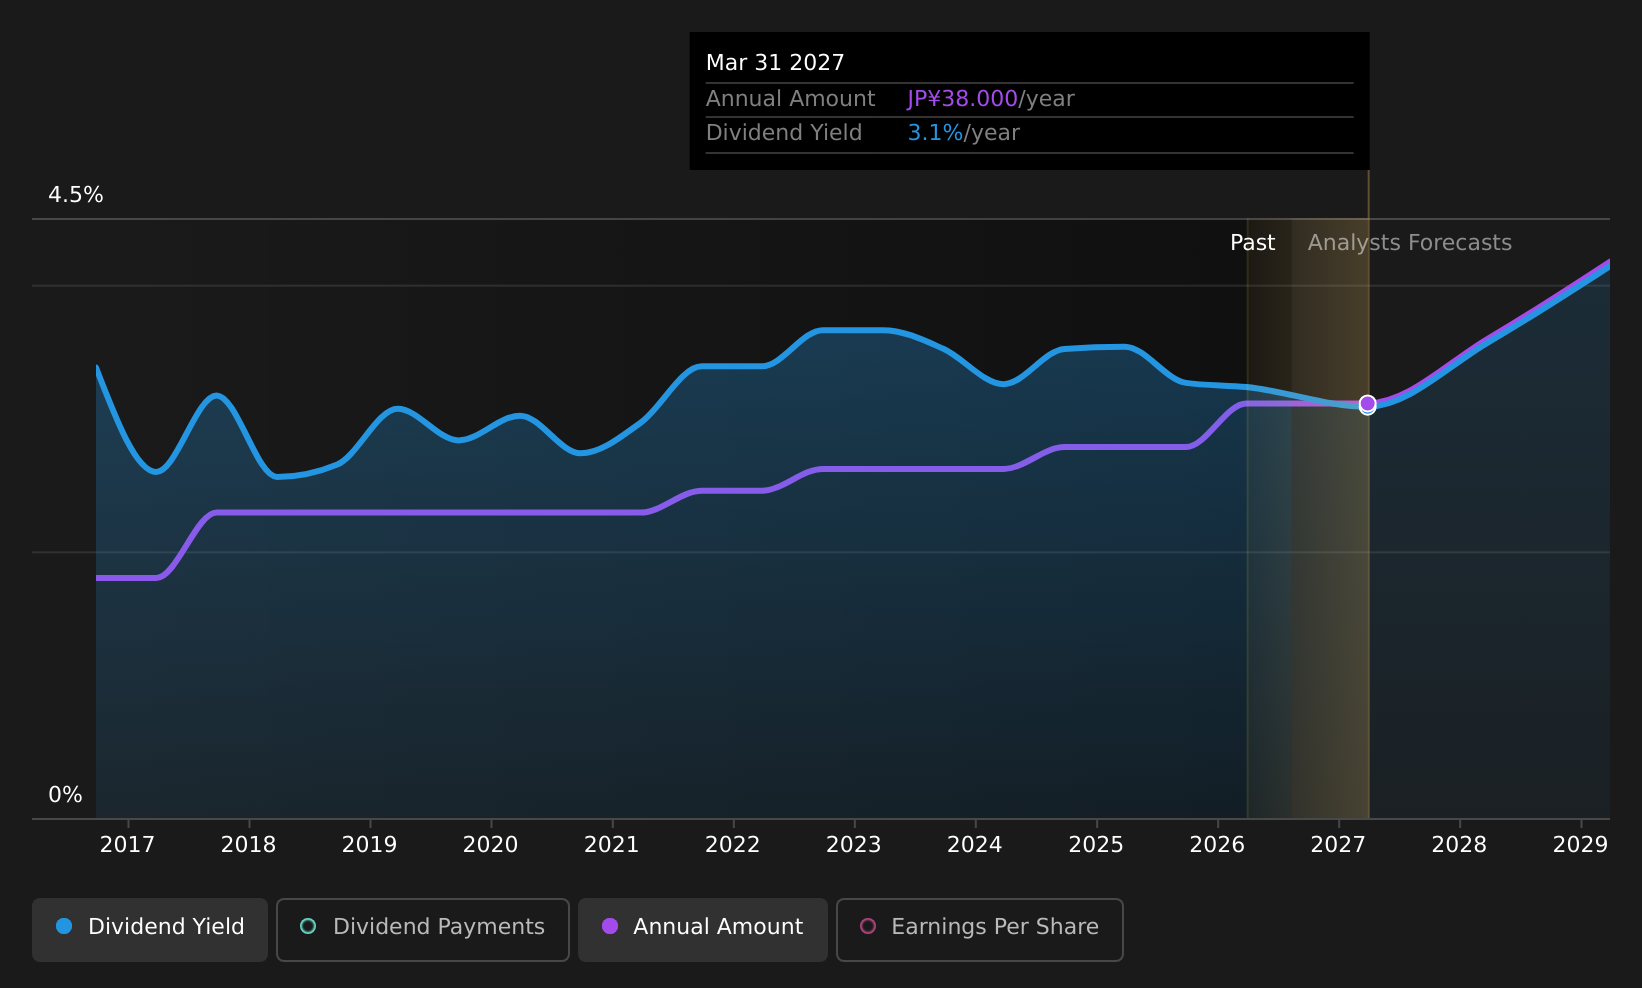
Dividend Yield: 3.1%
TOKAI Holdings' dividend payments are well-supported by earnings and cash flows, with payout ratios of 41.4% and 44.6%, respectively. The company announced a share buyback program to enhance shareholder returns, repurchasing up to ¥5 billion worth of shares. Despite a stable dividend history over the past decade, its yield of 3.09% is below Japan's top-tier payers. Recent earnings growth and increased dividends offer potential stability amidst high debt levels.
- Navigate through the intricacies of TOKAI Holdings with our comprehensive dividend report here.
- Insights from our recent valuation report point to the potential overvaluation of TOKAI Holdings shares in the market.
Business Engineering (TSE:4828)
Simply Wall St Dividend Rating: ★★★★☆☆
Overview: Business Engineering Corporation designs, develops, and implements corporate information systems using ERP package products developed by other companies in Japan, with a market cap of ¥78.52 billion.
Operations: Business Engineering Corporation generates revenue through the design, development, and implementation of corporate information systems utilizing ERP package products created by other companies in Japan.
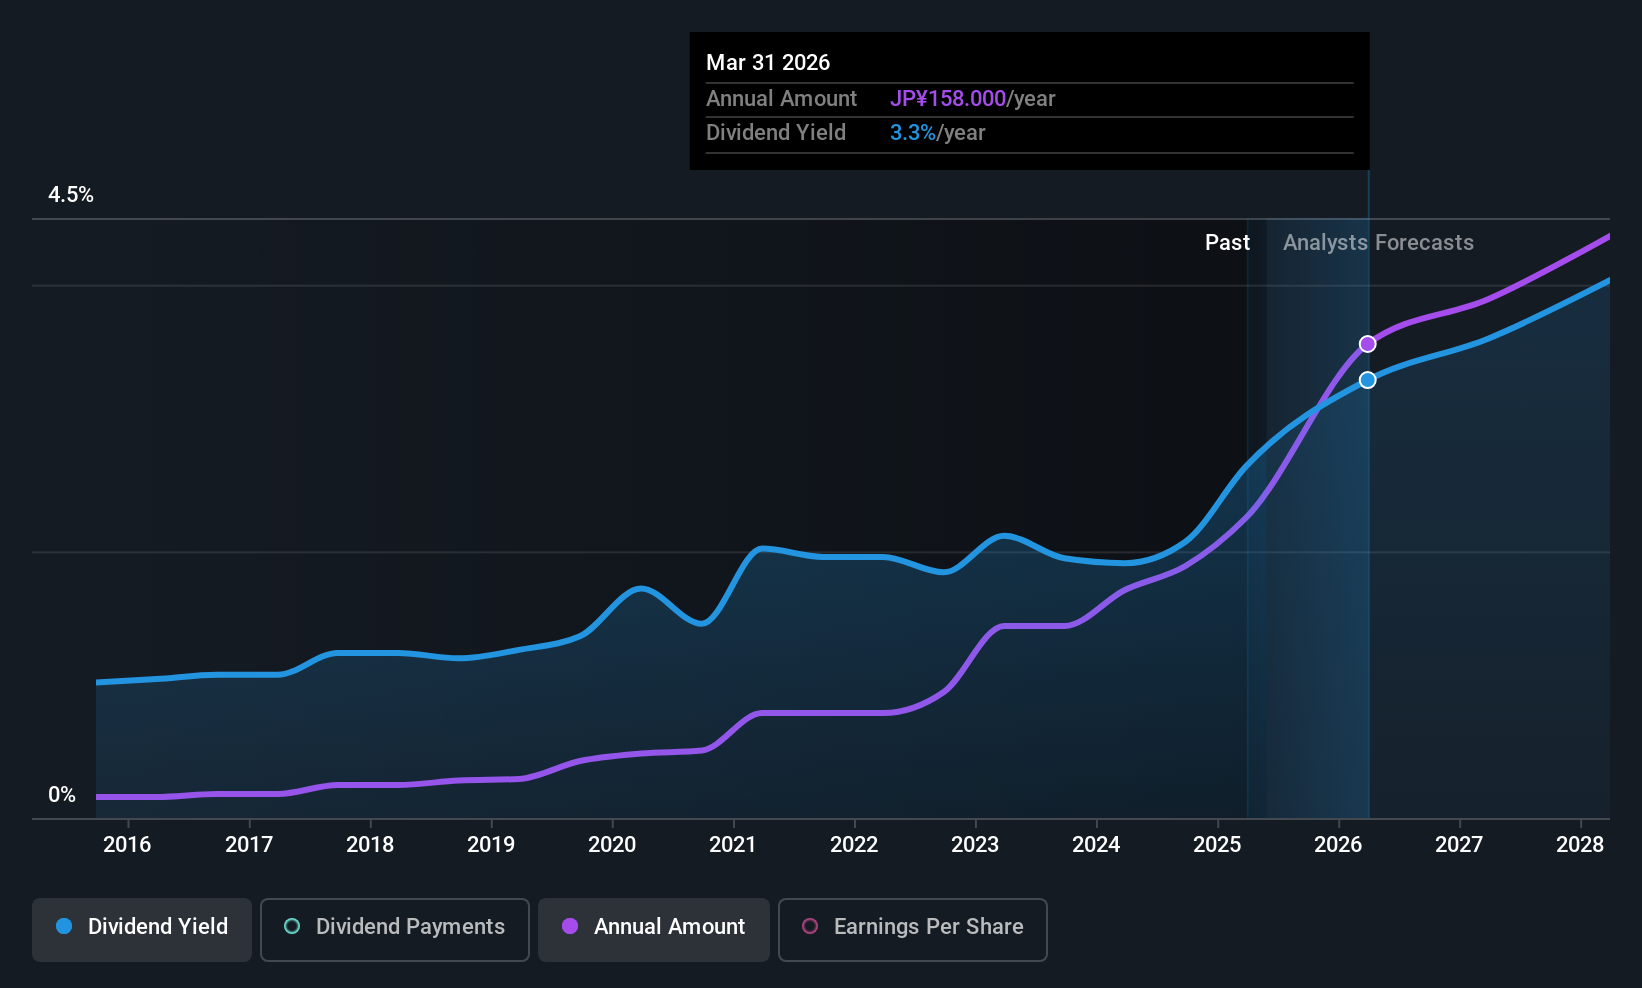
Dividend Yield: 3.2%
Business Engineering's dividends are covered by earnings and cash flows, with payout ratios of 51.9% and 52.8%, respectively. Despite a volatile dividend history, recent increases suggest potential growth. The current yield of 3.19% is lower than Japan's top quartile payers. Recent earnings reported JPY 6,781.44 million in sales for Q1, up from the previous year, though net income slightly decreased to JPY 1,274.6 million from JPY 1,371.53 million.
- Click here and access our complete dividend analysis report to understand the dynamics of Business Engineering.
- The analysis detailed in our Business Engineering valuation report hints at an deflated share price compared to its estimated value.
Summing It All Up
- Gain an insight into the universe of 1025 Top Asian Dividend Stocks by clicking here.
- Have you diversified into these companies? Leverage the power of Simply Wall St's portfolio to keep a close eye on market movements affecting your investments.
- Simply Wall St is your key to unlocking global market trends, a free user-friendly app for forward-thinking investors.
Seeking Other Investments?
- Explore high-performing small cap companies that haven't yet garnered significant analyst attention.
- Fuel your portfolio with companies showing strong growth potential, backed by optimistic outlooks both from analysts and management.
- Find companies with promising cash flow potential yet trading below their fair value.
This article by Simply Wall St is general in nature. We provide commentary based on historical data and analyst forecasts only using an unbiased methodology and our articles are not intended to be financial advice. It does not constitute a recommendation to buy or sell any stock, and does not take account of your objectives, or your financial situation. We aim to bring you long-term focused analysis driven by fundamental data. Note that our analysis may not factor in the latest price-sensitive company announcements or qualitative material. Simply Wall St has no position in any stocks mentioned.
Have feedback on this article? Concerned about the content? Get in touch with us directly. Alternatively, email editorial-team@simplywallst.com