


BIPROGY (TSE:8056) has issued fresh guidance for the fiscal year ending March 2027. The company paired a higher second quarter dividend outlook with detailed projections for revenue, profit and earnings per share.
See our latest analysis for BIPROGY.
Following the updated guidance and higher interim dividend, BIPROGY’s latest share price of ¥4,516 comes after a 1 day share price return of 3.60%. However, the share price remains down 16.22% year to date and the 1 year total shareholder return is down 29.22%, while the 3 year and 5 year total shareholder returns of 34.37% and 79.25% suggest longer term holders have still seen gains. Recent momentum has therefore softened compared with earlier periods.
If the new guidance has you reassessing opportunities in tech and automation, it can help to see what else is on the move and uncover 39 robotics and automation stocks.
BIPROGY’s guidance now sits against a share price that has pulled back sharply, while analyst targets and intrinsic estimates point higher. Is the recent rebound a blip or is the discount still meaningful?
Price to Earnings of 14.6x for BIPROGY: Is It Justified?
BIPROGY is trading on a P/E of 14.6x, which sits below both peers and the broader JP IT sector, while its share price is ¥4,516.
The P/E ratio compares BIPROGY’s current share price to its earnings per share. For a software and services company with positive earnings, this is a common way investors assess how much they are paying for each unit of current profit.
On the data provided, BIPROGY is described as trading at good value versus peers with an average P/E of 21.7x and the JP IT industry at 16.2x. The estimated fair P/E of 21.4x is also higher than the current multiple. This indicates the market valuation may be relatively low compared with that reference point if sentiment or expectations were to realign.
Explore the SWS fair ratio for BIPROGY
Result: Price-to-earnings of 14.6x (UNDERVALUED)
However, BIPROGY’s weaker 1 year return and recent share price pullback still signal that any shift in tech spending or outsourcing budgets could pressure the story.
Find out about the key risks to this BIPROGY narrative.
Another View on BIPROGY Using the SWS DCF Model
The earlier P/E workup suggested BIPROGY looks inexpensive at 14.6x earnings. A second check using the SWS DCF model points the same way, with an estimated future cash flow value of ¥5,350.38 per share, about 15.6% above the current ¥4,516 price. How much weight do you give to cash flow based fair value?
Look into how the SWS DCF model arrives at its fair value.
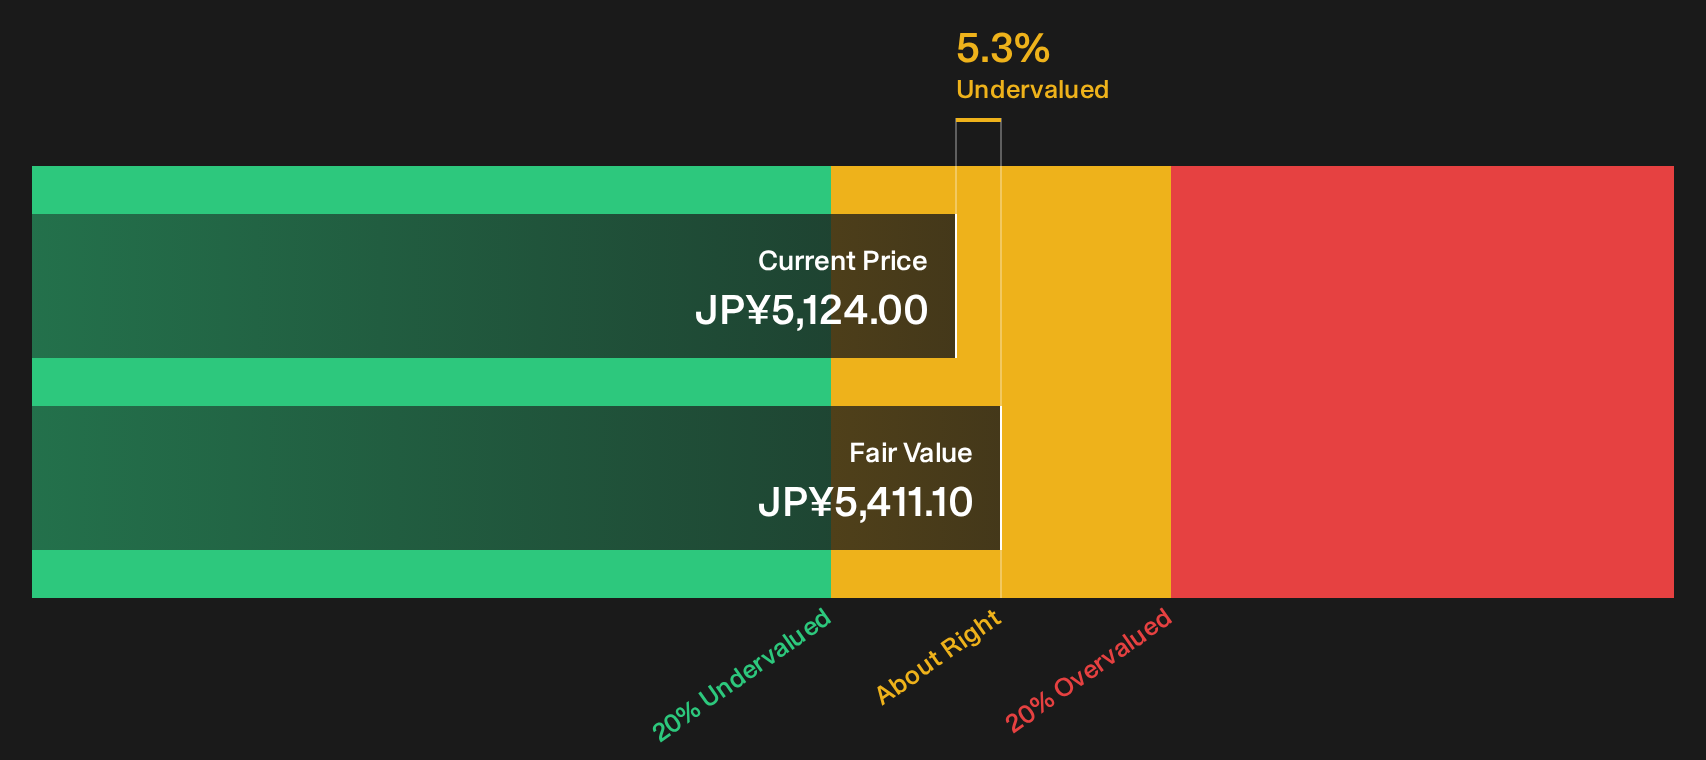
Simply Wall St performs a discounted cash flow (DCF) on every stock in the world every day (check out BIPROGY for example). We show the entire calculation in full. You can track the result in your watchlist or portfolio and be alerted when this changes, or use our stock screener to discover 23 high quality undervalued stocks. If you save a screener we even alert you when new companies match - so you never miss a potential opportunity.
Next Steps
Given the mix of signals around BIPROGY, it can be useful to look past headlines and review the details yourself while sentiment is still adjusting. To weigh the balance of concerns and potential upsides in a single place, start with the 5 key rewards and 1 important warning sign.
Looking for more BIPROGY investment ideas?
If BIPROGY has sharpened your focus, now is the time to widen your watchlist. Do not leave potential opportunities sitting off your radar.
- Focus on quality at a discount by checking companies that screen as 23 high quality undervalued stocks.
- Strengthen your income stream by hunting for reliable payers in the 37 dividend fortresses.
- Protect your downside by reviewing companies highlighted in the 54 resilient stocks with low risk scores.
This article by Simply Wall St is general in nature. We provide commentary based on historical data and analyst forecasts only using an unbiased methodology and our articles are not intended to be financial advice. It does not constitute a recommendation to buy or sell any stock, and does not take account of your objectives, or your financial situation. We aim to bring you long-term focused analysis driven by fundamental data. Note that our analysis may not factor in the latest price-sensitive company announcements or qualitative material. Simply Wall St has no position in any stocks mentioned.
Have feedback on this article? Concerned about the content? Get in touch with us directly. Alternatively, email editorial-team@simplywallst.com