


SolarEdge Technologies (SEDG) has drawn fresh attention after reporting second quarter 2026 results, issuing third quarter revenue guidance of US$310 million to US$340 million, and highlighting wider Nexis platform deployment through its ConnectDER partnership.
See our latest analysis for SolarEdge Technologies.
SolarEdge Technologies' latest earnings update, new third quarter revenue guidance and wider Nexis platform rollout have come after a sharp 30 day share price return of down 39.37%. The 5 year total shareholder return of down 88.46% highlights how long term holders have experienced significant value erosion, despite a 1 year total shareholder return of 4.04% and a current share price of US$32.42.
If you are comparing SolarEdge Technologies with other clean energy and electrification plays, it can be useful to see what else is moving in power and grid technology right now using the 40 power grid technology and infrastructure stocks
The sharp reset in SolarEdge Technologies' share price, set against ongoing losses and Nexis rollout progress, now puts the focus squarely on valuation. Do current levels still compensate you for the risks involved?
Most Popular Narrative: 28.4% Undervalued
Against SolarEdge Technologies' last close of $32.42, the most followed narrative points to a fair value of $45.25, using a 14.98% discount rate to weigh long term cash flows and risks.
The rally in SolarEdge's stock appears to be pricing in robust future revenue growth driven by U.S. policy support (extension of manufacturing and storage credits), but risks are rising as the elimination of the 25D residential solar tax credit is expected to cause a substantial drop in U.S. residential demand in 2026, only partially offset by third-party owned (TPO) shifts, potentially constraining topline growth.
Want to see how a loss making SolarEdge today is modeled to turn the corner on margins and earnings? The key assumptions behind that path are anything but conservative.
Result: Fair Value of $45.25 (UNDERVALUED)
Have a read of the narrative in full and understand what's behind the forecasts.
However, there is still a risk that weaker U.S. residential solar demand and fierce pricing competition in Europe could pressure SolarEdge Technologies' margins and delay any earnings recovery.
Find out about the key risks to this SolarEdge Technologies narrative.
Another View Using The SWS DCF Model
The analyst narrative suggests SolarEdge Technologies looks 28.4% undervalued at $32.42 based on future earnings and multiples. However, the SWS DCF model points to a fair value of $26.09, which would put the stock above that estimate instead. Which set of assumptions appears more convincing?
Look into how the SWS DCF model arrives at its fair value.
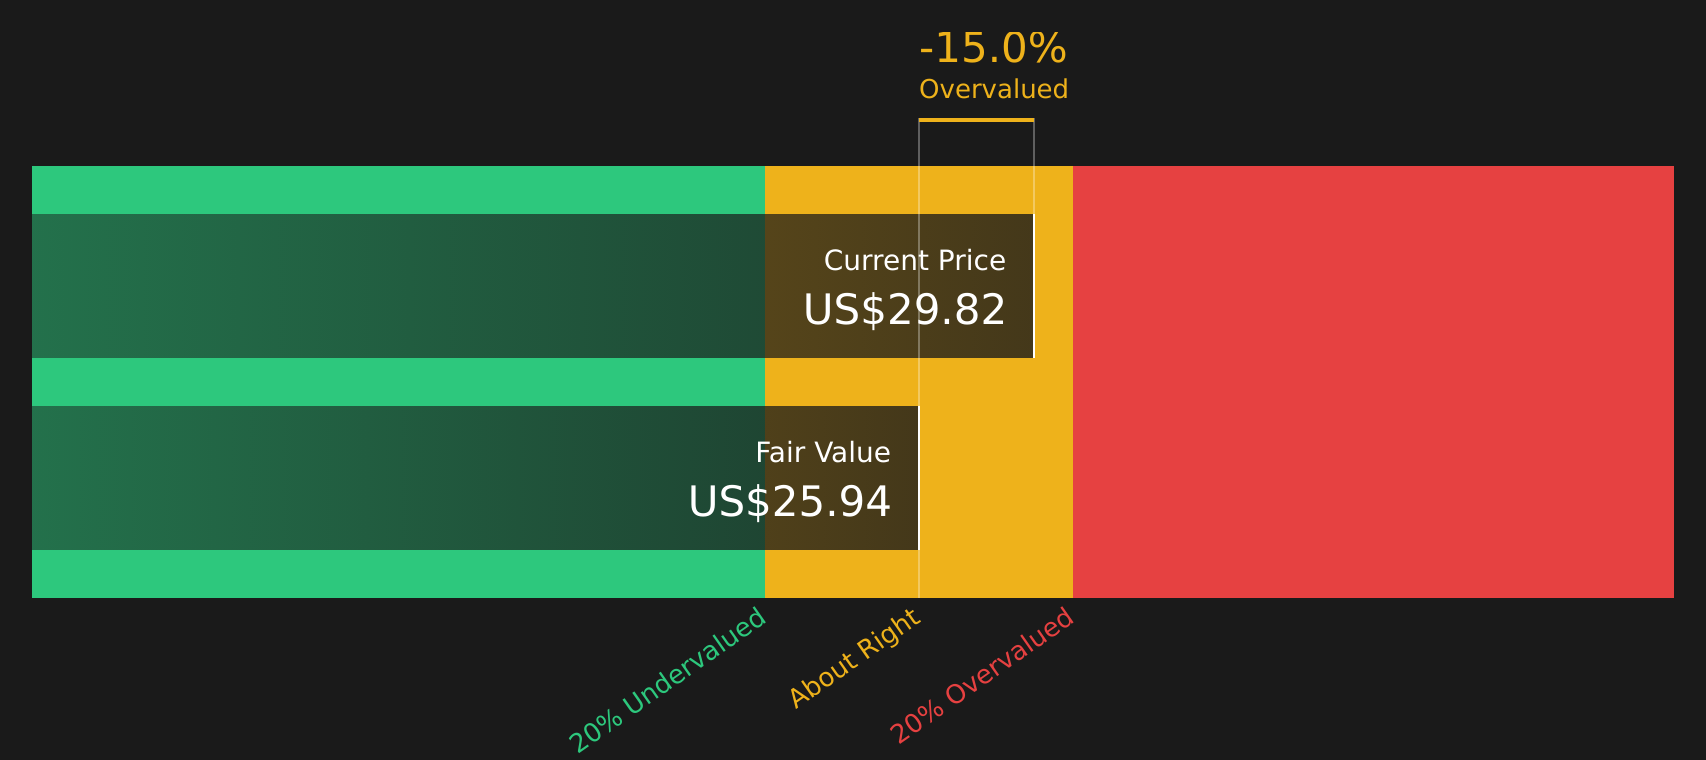
Simply Wall St performs a discounted cash flow (DCF) on every stock in the world every day (check out SolarEdge Technologies for example). We show the entire calculation in full. You can track the result in your watchlist or portfolio and be alerted when this changes, or use our stock screener to discover 52 high quality undervalued stocks. If you save a screener we even alert you when new companies match - so you never miss a potential opportunity.
Next Steps
Does the mixed tone around SolarEdge Technologies leave you unsure which way to lean? Take a closer look at the data points that matter most, act promptly while information is fresh in the market, and weigh both the potential upside and the downside using the 2 key rewards and 1 important warning sign.
Looking for more investment ideas beyond SolarEdge Technologies?
If SolarEdge Technologies has sharpened your focus on opportunities, do not stop here. Broaden your watchlist now and avoid missing other compelling setups across the market.
- Tap into potential growth by scanning 20 elite penny stocks with strong financials that pair smaller market values with stronger financial profiles than many would expect.
- Zero in on value by reviewing the 52 high quality undervalued stocks that combine solid fundamentals with prices that our models flag as attractive.
- Strengthen your downside protection by checking the 80 resilient stocks with low risk scores that show resilient risk scores and steadier financial characteristics.
This article by Simply Wall St is general in nature. We provide commentary based on historical data and analyst forecasts only using an unbiased methodology and our articles are not intended to be financial advice. It does not constitute a recommendation to buy or sell any stock, and does not take account of your objectives, or your financial situation. We aim to bring you long-term focused analysis driven by fundamental data. Note that our analysis may not factor in the latest price-sensitive company announcements or qualitative material. Simply Wall St has no position in any stocks mentioned.
Have feedback on this article? Concerned about the content? Get in touch with us directly. Alternatively, email editorial-team@simplywallst.com