


Shizuoka Financial Group Inc (TSE:5831) has drawn investor attention after raising full year earnings guidance, lifting dividend forecasts, reporting higher first quarter profit, and launching a sizeable share repurchase program.
See our latest analysis for Shizuoka Financial GroupInc.
These announcements come on top of strong recent performance, with Shizuoka Financial GroupInc’s share price returning 42.6% year to date and 20.27% over 90 days. The 1 year total shareholder return of 90.49% points to sustained momentum.
If the combination of rising guidance, dividends, and buybacks has your attention, this can be a good moment to look at other banks and financials through 11 top founder-led companies
After a 90% 1-year total return and upgraded guidance, dividends, and buybacks, Shizuoka Financial Group Inc now raises a different question: Is most of the rerating already behind the stock, or is there still clear upside on valuation?
Price-to-Earnings of 18.7x: Is it justified?
On the latest figures, Shizuoka Financial Group Inc trades on a P/E of 18.7x, which sits above both the Japan banks industry average of 15.4x and the peer average of 18.2x. That points to the market assigning a richer price tag to each yen of current earnings compared with many other banks.
The P/E ratio compares the current share price with earnings per share. For a bank like Shizuoka Financial Group Inc, it gives a quick read on how much investors pay today for the earnings the business is already generating. A higher P/E can reflect expectations for steadier or stronger profits, or a preference for the company’s specific business profile within the sector.
In Shizuoka Financial Group Inc’s case, the SWS DCF model estimate of fair value implies the shares trade around 19.8% below that cash flow based value at ¥4,426.47, yet the P/E is higher than both the industry average and the estimated fair P/E of 16.2x. That mix suggests the market is putting a premium on current earnings relative to peers, while the DCF output points to some room between the share price of ¥3,548 and the modelled fair value that could narrow if those cash flows materialise as expected.
The current P/E of 18.7x is higher than the Japan banks industry average of 15.4x, and also above the peer average of 18.2x. Compared with the fair P/E estimate of 16.2x, the gap is even clearer and sets a level the market could move towards if sentiment or earnings expectations change.
Explore the SWS fair ratio for Shizuoka Financial GroupInc
Result: Preferred multiple of Price-to-Earnings of 18.7x (OVERVALUED)
However, Shizuoka Financial Group Inc still faces risks if annual revenue contraction continues or if the share price premium over the analyst target of ¥3,402.86 narrows.
Find out about the key risks to this Shizuoka Financial GroupInc narrative.
Another view on Shizuoka Financial Group Inc’s value
While the P/E ratio suggests Shizuoka Financial Group Inc trades on a richer multiple than many peers, the SWS DCF model points the other way. On that cash flow view, the current share price of ¥3,548 sits about 19.8% below an estimated fair value of ¥4,426.47, which frames the stock as undervalued instead of expensive.
For an investor, that creates a clear split between what earnings multiples indicate and what the cash flow model implies. The key question is which signal to rely on more when considering the balance of risk and opportunity from here.
Look into how the SWS DCF model arrives at its fair value.
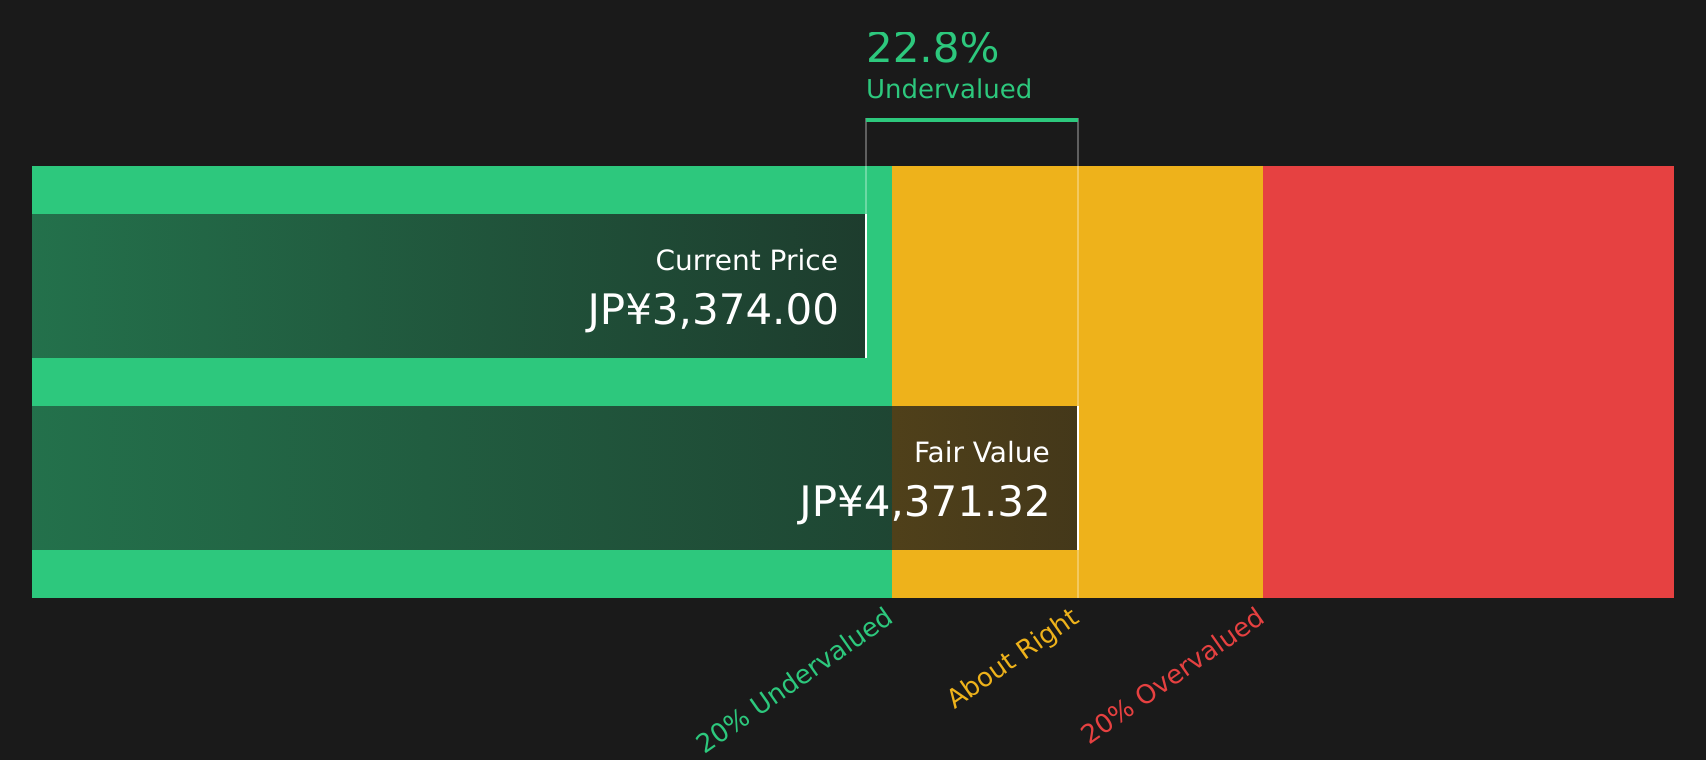
Simply Wall St performs a discounted cash flow (DCF) on every stock in the world every day (check out Shizuoka Financial GroupInc for example). We show the entire calculation in full. You can track the result in your watchlist or portfolio and be alerted when this changes, or use our stock screener to discover 23 high quality undervalued stocks. If you save a screener we even alert you when new companies match - so you never miss a potential opportunity.
Next Steps
If the mixed signals around Shizuoka Financial Group Inc leave you unsure, use this moment to review the data and make a prompt decision for yourself based on 4 key rewards and 1 important warning sign
Looking for more investment ideas beyond Shizuoka Financial Group Inc?
If Shizuoka Financial Group Inc has sharpened your focus on opportunities, do not stop here. Use this momentum to compare other stocks and refine your watchlist.
- Explore potentially resilient returns by checking companies that score well on stability through the 59 resilient stocks with low risk scores.
- Look for quality at a reasonable price by scanning companies highlighted in the 23 high quality undervalued stocks.
- Identify potential future leaders early by reviewing the screener containing 67 high quality undiscovered gems before others catch on.
This article by Simply Wall St is general in nature. We provide commentary based on historical data and analyst forecasts only using an unbiased methodology and our articles are not intended to be financial advice. It does not constitute a recommendation to buy or sell any stock, and does not take account of your objectives, or your financial situation. We aim to bring you long-term focused analysis driven by fundamental data. Note that our analysis may not factor in the latest price-sensitive company announcements or qualitative material. Simply Wall St has no position in any stocks mentioned.
Have feedback on this article? Concerned about the content? Get in touch with us directly. Alternatively, email editorial-team@simplywallst.com