


As the Asian markets navigate a landscape marked by resilient economic data and geopolitical uncertainties, investors are increasingly focused on identifying opportunities within this dynamic region. In such an environment, stocks that analysts estimate may be trading below their intrinsic value can offer potential for growth, making them appealing to those seeking to capitalize on market inefficiencies.
Top 10 Undervalued Stocks Based On Cash Flows In Asia
| Name | Current Price | Fair Value (Est) | Discount (Est) |
| Winall Hi-tech Seed (SZSE:300087) | CN¥5.44 | CN¥10.84 | 49.8% |
| Visional (TSE:4194) | ¥9064.00 | ¥17716.18 | 48.8% |
| Thonburi Healthcare Group (SET:THG) | THB7.65 | THB14.99 | 49% |
| Mao Geping Cosmetics (SEHK:1318) | HK$50.80 | HK$101.56 | 50% |
| Japan Eyewear Holdings (TSE:5889) | ¥2536.00 | ¥5008.79 | 49.4% |
| ISU Petasys (KOSE:A007660) | ₩95600.00 | ₩189761.28 | 49.6% |
| gremsInc (TSE:3150) | ¥2510.00 | ¥4903.22 | 48.8% |
| GoodWe Technologies (SHSE:688390) | CN¥70.49 | CN¥138.09 | 49% |
| BEAUTY GARAGE (TSE:3180) | ¥1551.00 | ¥3089.74 | 49.8% |
| Akeso (SEHK:9926) | HK$90.50 | HK$179.31 | 49.5% |
We're going to check out a few of the best picks from our screener tool.
GoodWe Technologies (SHSE:688390)
Overview: GoodWe Technologies Co., Ltd. is involved in the research, manufacture, and sale of photovoltaic inverters and energy storage solutions both in China and internationally, with a market cap of CN¥16.92 billion.
Operations: GoodWe Technologies generates revenue primarily from the photovoltaic industry, amounting to CN¥9.37 billion.
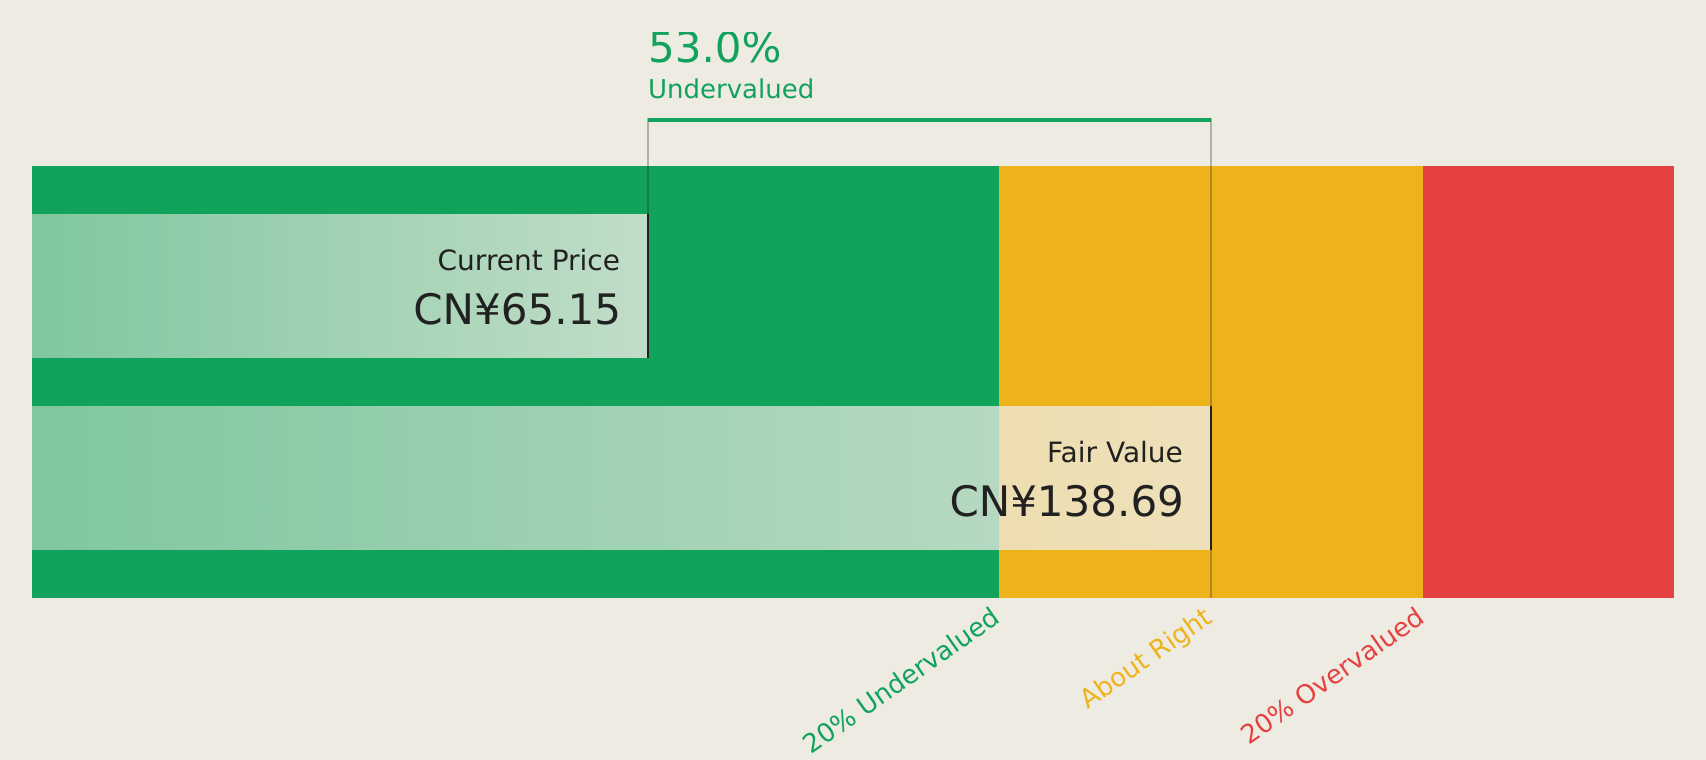
Estimated Discount To Fair Value: 49%
GoodWe Technologies is trading at CN¥70.49, significantly below its estimated future cash flow value of CN¥138.09, indicating strong undervaluation based on discounted cash flows. Despite recent share price volatility, the company became profitable this year and is projected to see earnings grow by 45.25% annually over the next three years. However, financial results include large one-off items which may affect perceived earnings quality.
- Our comprehensive growth report raises the possibility that GoodWe Technologies is poised for substantial financial growth.
- Click here and access our complete balance sheet health report to understand the dynamics of GoodWe Technologies.
Medley (TSE:4480)
Overview: Medley, Inc. operates platforms for recruitment and medical businesses in Japan and the United States with a market cap of ¥84.92 billion.
Operations: The company's revenue is derived from its Human Resource Platform Business at ¥29.59 billion, Medical Platform Business at ¥10.40 billion, and New Services at ¥1.01 billion.
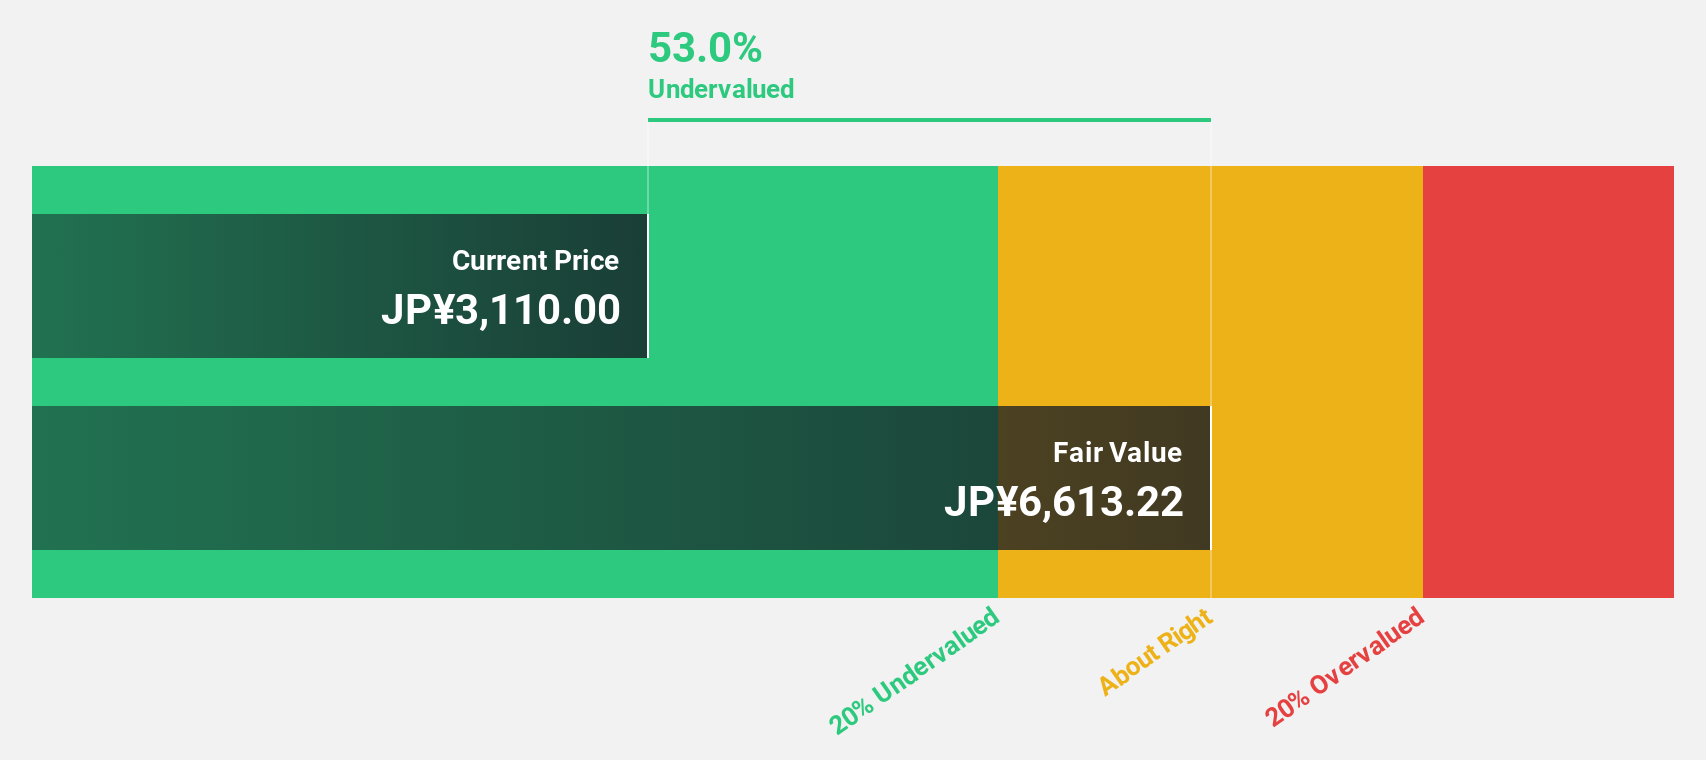
Estimated Discount To Fair Value: 32.7%
Medley is trading at ¥2,810, significantly below its estimated future cash flow value of ¥4,177.07, highlighting strong undervaluation potential. Despite high debt levels and recent share price volatility, earnings grew by 27% last year and are forecast to grow 26% annually over the next three years—outpacing the JP market's growth rate. Recent half-year results showed sales increased to ¥22.68 billion from ¥18.47 billion a year ago, with net income more than doubling.
- In light of our recent growth report, it seems possible that Medley's financial performance will exceed current levels.
- Navigate through the intricacies of Medley with our comprehensive financial health report here.
Shibaura Mechatronics (TSE:6590)
Overview: Shibaura Mechatronics Corporation, with a market cap of ¥300.63 billion, manufactures and sells semiconductor manufacturing equipment, flat panel displays manufacturing equipment, vacuum equipment, and health-related equipment across Japan, China, Taiwan, the United States, and other international markets.
Operations: Shibaura Mechatronics generates revenue through its segments in semiconductor manufacturing equipment, flat panel displays manufacturing equipment, vacuum equipment, and health-related equipment across various international markets including Japan, China, Taiwan, and the United States.
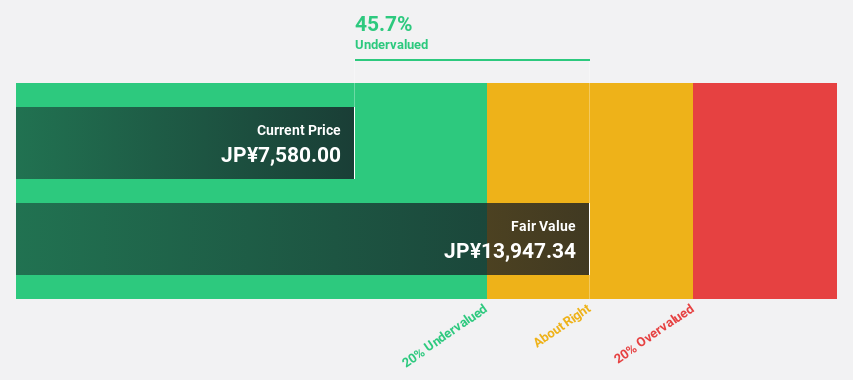
Estimated Discount To Fair Value: 47.6%
Shibaura Mechatronics is trading at ¥4,580, well below its estimated future cash flow value of ¥8,737.14, indicating strong undervaluation. The company forecasts robust revenue growth of 18.2% annually and earnings growth of 32.5%, both surpassing the JP market averages. Despite recent share price volatility, its return on equity is expected to reach 27.3% in three years. For fiscal year ending March 2027, projected net sales are ¥99 billion with a dividend increase to ¥64 per share.
- Insights from our recent growth report point to a promising forecast for Shibaura Mechatronics' business outlook.
- Click here to discover the nuances of Shibaura Mechatronics with our detailed financial health report.
Make It Happen
- Click here to access our complete index of 212 Undervalued Asian Stocks Based On Cash Flows.
- Have you diversified into these companies? Leverage the power of Simply Wall St's portfolio to keep a close eye on market movements affecting your investments.
- Unlock the power of informed investing with Simply Wall St, your free guide to navigating stock markets worldwide.
Ready For A Different Approach?
- Explore high-performing small cap companies that haven't yet garnered significant analyst attention.
- Diversify your portfolio with solid dividend payers offering reliable income streams to weather potential market turbulence.
- Fuel your portfolio with companies showing strong growth potential, backed by optimistic outlooks both from analysts and management.
This article by Simply Wall St is general in nature. We provide commentary based on historical data and analyst forecasts only using an unbiased methodology and our articles are not intended to be financial advice. It does not constitute a recommendation to buy or sell any stock, and does not take account of your objectives, or your financial situation. We aim to bring you long-term focused analysis driven by fundamental data. Note that our analysis may not factor in the latest price-sensitive company announcements or qualitative material. Simply Wall St has no position in any stocks mentioned.
Have feedback on this article? Concerned about the content? Get in touch with us directly. Alternatively, email editorial-team@simplywallst.com