


Innovent Biologics (SEHK:1801) caught investor attention after reporting product revenue of over CN¥4.3b for Q2 2026 and more than CN¥8.2b for the first half, supported by its dual engine growth strategy.
See our latest analysis for Innovent Biologics.
Those revenue headlines have arrived alongside firm share price momentum, with Innovent Biologics delivering a 30 day share price return of 8.66% and a 90 day share price return of 21.73%, while the three year total shareholder return of 212.28% contrasts with a slightly negative 1 year total shareholder return.
If this kind of biotech growth story interests you, it can be useful to widen the search using a screener focused on healthcare related AI opportunities such as 129 healthcare AI stocks.
Innovent Biologics trades at a sizeable discount to both analyst targets and an estimated intrinsic value, even after the recent share price gain. Is this a sign of excessive market caution, or a fair reflection of risk?
Preferred Price-to-Sales Multiple of 11.1x: Is It Justified?
Innovent Biologics last closed at HK$96.65 and is assessed as trading at good value compared with both peers and the wider Hong Kong biotechs industry. The key metric behind that view is its P/S ratio of 11.1x, which sits below several benchmarks while the stock also trades at a sizeable discount to both analyst targets and an estimated intrinsic value.
The P/S ratio compares a company’s market value with its revenue and is often used for biopharma businesses where earnings can be volatile as products move through development and commercialisation. For Innovent Biologics, this means investors are currently paying 11.1 times its revenue for exposure to its antibody and protein drug portfolio across oncology, ophthalmology and several other therapy areas.
According to the SWS checks, that 11.1x P/S is below the estimated fair P/S ratio of 11.8x that is derived from a regression based fair ratio model. It is also below the peer average P/S of 21.6x and the Hong Kong biotechs industry average of 11.9x, which suggests the current market pricing sits at the lower end of what similar companies trade on and below the level that modelled relationships indicate the market could move towards over time.
Explore the SWS fair ratio for Innovent Biologics
Result: Price-to-Sales of 11.1x (UNDERVALUED)
However, Innovent Biologics still faces risks from its heavy revenue exposure to the PRC market and the ongoing costs of advancing a broad R&D pipeline.
Find out about the key risks to this Innovent Biologics narrative.
Another View On Innovent Biologics Using Our DCF Model
The first check used revenue and a P/S ratio to flag Innovent Biologics as good value. Our DCF model points in the same direction. It suggests a fair value of about HK$166.03 per share versus the current HK$96.65 price, which implies a sizeable valuation gap investors need to interpret carefully.
The DCF output frames Innovent Biologics as trading about 41.8% below that fair value estimate. That appears attractive on paper, but it also raises a practical question for you as an investor: How comfortable are you with the assumptions that sit inside the cash flow forecasts that drive this result?
Look into how the SWS DCF model arrives at its fair value.
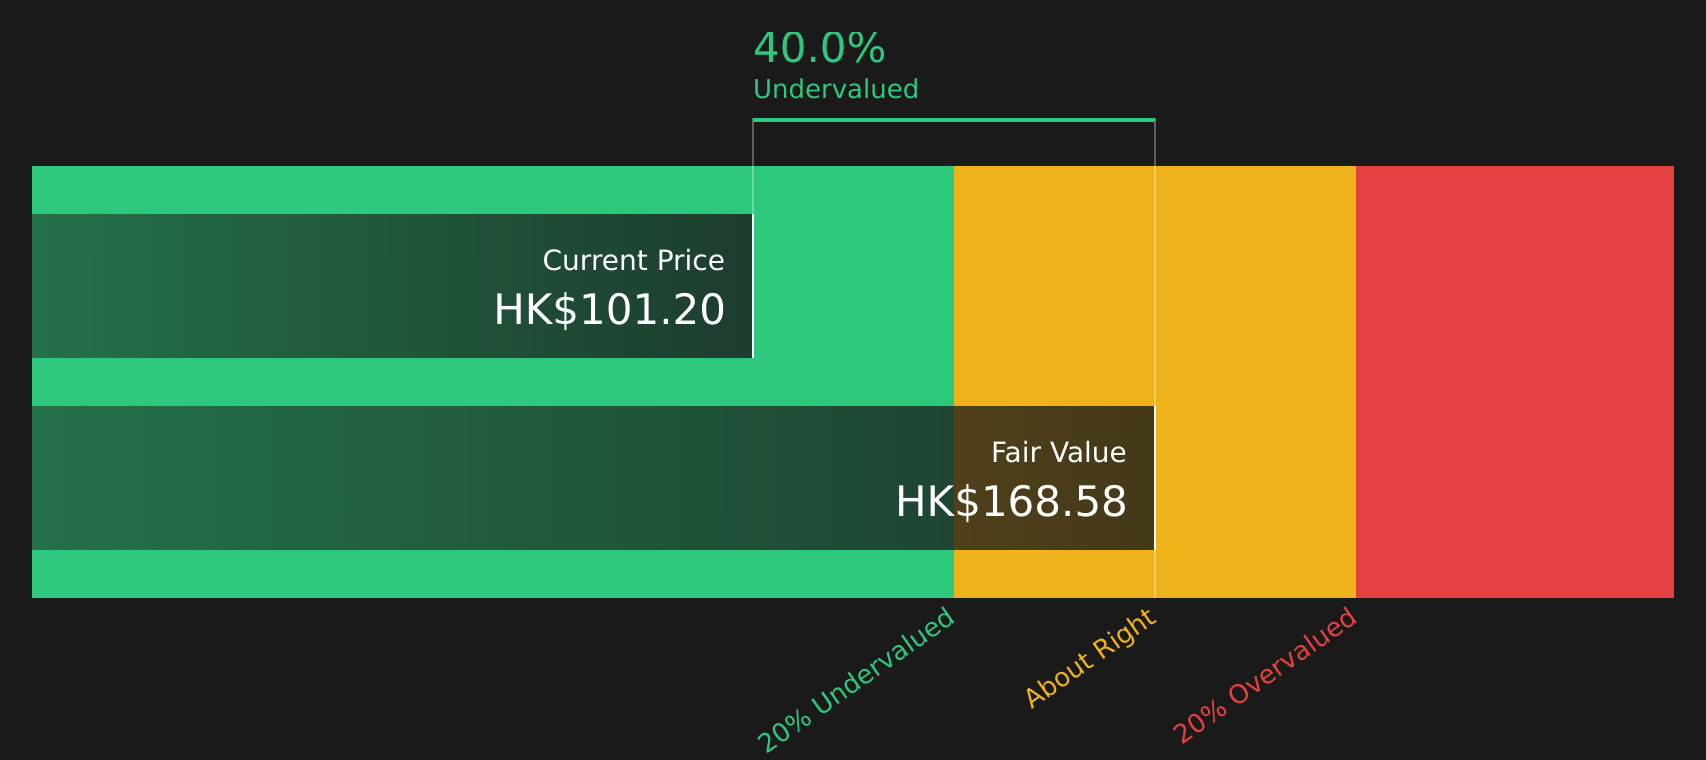
Simply Wall St performs a discounted cash flow (DCF) on every stock in the world every day (check out Innovent Biologics for example). We show the entire calculation in full. You can track the result in your watchlist or portfolio and be alerted when this changes, or use our stock screener to discover 265 high quality undervalued stocks. If you save a screener we even alert you when new companies match - so you never miss a potential opportunity.
Next Steps
Given the mixed signals around Innovent Biologics, it makes sense to review the data yourself and decide how to weigh the upside. To understand what is driving optimism, take a closer look at the company's 1 or more identified rewards through the 5 key rewards.
Looking for more investment ideas beyond Innovent Biologics?
If you want to build on the work you have done on Innovent Biologics, the next step is to line up fresh ideas that could fit your watchlist.
- Target potential high growth stories early by scanning 219 elite penny stocks with strong financials that already show stronger financial profiles than many micro caps.
- Strengthen the core of your portfolio by reviewing 265 high quality undervalued stocks that combine quality fundamentals with pricing that still looks reasonable on key metrics.
- Prioritise resilience by focusing on 290 resilient stocks with low risk scores that score well on balance sheet strength and earnings stability.
This article by Simply Wall St is general in nature. We provide commentary based on historical data and analyst forecasts only using an unbiased methodology and our articles are not intended to be financial advice. It does not constitute a recommendation to buy or sell any stock, and does not take account of your objectives, or your financial situation. We aim to bring you long-term focused analysis driven by fundamental data. Note that our analysis may not factor in the latest price-sensitive company announcements or qualitative material. Simply Wall St has no position in any stocks mentioned.
Have feedback on this article? Concerned about the content? Get in touch with us directly. Alternatively, email editorial-team@simplywallst.com