


Emera (TSX:EMA) has drawn fresh attention after reporting second quarter 2026 earnings, showing revenue of CA$2,011 million and lower net income and earnings per share compared with the same period last year.
See our latest analysis for Emera.
Emera's latest earnings news comes after a period where the share price has had mixed momentum, with a 1-month share price return down 7.26% but a 1-year total shareholder return of 12.99% and 5-year total shareholder return of 53.82%, highlighting longer term gains.
If this earnings update has you reassessing utilities, it could be a good moment to look at other power and grid related opportunities using our 39 power grid technology and infrastructure stocks
Emera's share price has pulled back over the past month even though longer term returns remain strong. Has most of the opportunity already played out, or does the current valuation still leave meaningful upside ahead for new buyers?
Most Popular Narrative: 3.9% Undervalued
The most followed narrative on Emera compares a fair value of about CA$74.45 to the last close at CA$71.58, suggesting a modest valuation gap that rests on long term cash flow assumptions rather than short term price swings.
The company is investing heavily in grid modernization, renewables (notably, a $2+ billion solar expansion in Florida), and infrastructure resilience. These initiatives are supported by favorable regulatory environments and customer growth, which in turn support stable, long-term increases in rate base and revenue growth.
Want to see what sits behind that fair value for Emera? The narrative leans on measured revenue growth, firmer margins and a future earnings multiple that assumes steady execution rather than a stretch scenario.
Result: Fair Value of CA$74.45 (UNDERVALUED)
Have a read of the narrative in full and understand what's behind the forecasts.
However, Emera's story could shift quickly if refinancing costs stay elevated, or if more frequent extreme weather makes planned grid and solar spending harder to recover.
Find out about the key risks to this Emera narrative.
Another View On Emera’s Valuation
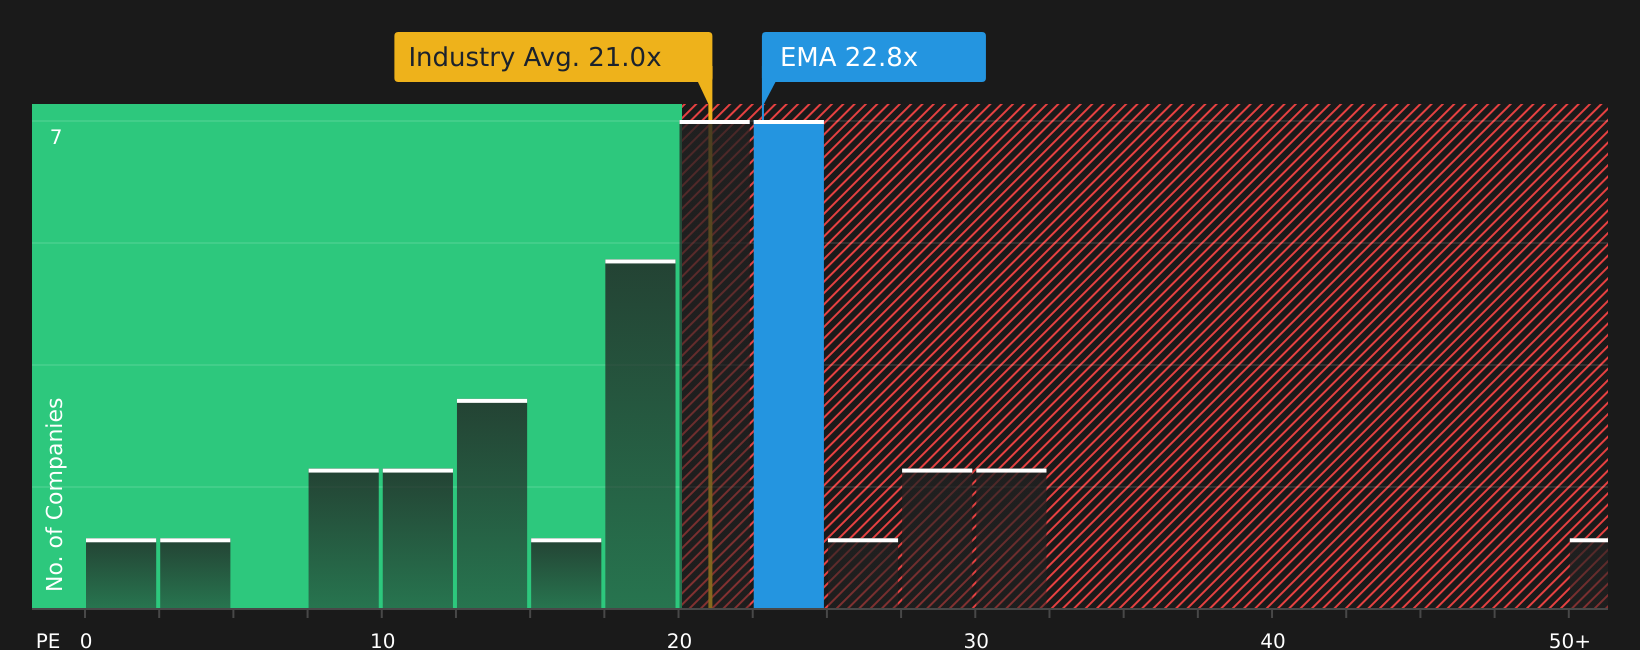
The most popular Emera narrative leans on a fair value of CA$74.45 based on cash flow and analyst targets. Yet on simple P/E maths, the picture is less straightforward. Emera trades on about 22.8x earnings, above peer averages near 21.2x, although below a fair ratio estimate of 31.3x.
That mix means the stock looks expensive beside the industry but cheaper than the fair ratio suggests the market could eventually move toward. For investors, the question is whether peer comparisons or the fair ratio provide the more useful perspective on valuation risk.
See what the numbers say about this price — find out in our valuation breakdown.
Next Steps
If this mix of optimism and concern around Emera leaves you unsure, take a closer look at the numbers, compare narratives, and decide where you stand. To help balance both sides of the story, review the 3 key rewards and 2 important warning signs
Looking for more investment ideas beyond Emera?
If Emera has sharpened your focus on opportunities, do not stop here. The right screener can quickly surface stocks that better match your risk and income goals.
- Target higher income potential by reviewing companies in the 4 dividend fortresses that may suit a portfolio focused on reliable cash payouts.
- Prioritise capital protection by assessing candidates in the 8 resilient stocks with low risk scores that score well on resilience and financial strength.
- Spot earlier stage opportunities by scanning the screener containing 8 high quality undiscovered gems before attention and valuations potentially move ahead of you.
This article by Simply Wall St is general in nature. We provide commentary based on historical data and analyst forecasts only using an unbiased methodology and our articles are not intended to be financial advice. It does not constitute a recommendation to buy or sell any stock, and does not take account of your objectives, or your financial situation. We aim to bring you long-term focused analysis driven by fundamental data. Note that our analysis may not factor in the latest price-sensitive company announcements or qualitative material. Simply Wall St has no position in any stocks mentioned.
Have feedback on this article? Concerned about the content? Get in touch with us directly. Alternatively, email editorial-team@simplywallst.com