


Why Nippon Shokubai Stock Is Back In Focus
Nippon Shokubai (TSE:4114) has drawn fresh attention after reporting first quarter results with higher sales and net income versus a year earlier, alongside new earnings and dividend guidance for the current fiscal year.
See our latest analysis for Nippon Shokubai.
The earnings and dividend updates appear to have coincided with strong buying interest, with Nippon Shokubai’s share price returning 29.51% over the past month and 33.06% year to date, while its 1 year total shareholder return of 57.79% points to momentum that has been building over a longer period.
If you are looking beyond Nippon Shokubai for other ideas in materials and related areas, this could be a good moment to see which companies feature in our 28 best rare earth metal stocks
Nippon Shokubai now couples a larger profit base with a richer dividend plan, and the stock price has reacted quickly. The key issue for you is whether that strength is already fully reflected in today’s valuation.
Preferred P/E of 17.5x for Nippon Shokubai: Is It Justified?
On the numbers supplied, Nippon Shokubai trades on a P/E of 17.5x, which screens as expensive compared with both its peers and its own estimated fair level.
The P/E ratio compares the current share price with earnings per share. For a chemicals group like Nippon Shokubai, it is often used as a shorthand for how much investors are prepared to pay today for its current profit base and the earnings that analysts expect over the coming years.
Here, the company’s 17.5x P/E sits above the peer average of 16.4x and also above an estimated fair P/E of 14x. That suggests the market is placing a richer value on each yen of Nippon Shokubai earnings than both similar Japanese chemicals stocks and the level that regression analysis points to as a potential anchor over time.
Against the wider Japanese chemicals industry, the contrast is even starker, given that the sector average P/E is 12.9x. In other words, Nippon Shokubai currently trades on a meaningfully higher multiple than typical industry peers, and also at a level that is above the fair ratio that the SWS model suggests the market could eventually move toward.
Explore the SWS fair ratio for Nippon Shokubai
Result: Preferred multiple of Price-to-Earnings of 17.5x (OVERVALUED)
However, you also need to weigh risks such as any shift in chemicals demand or changes to Nippon Shokubai’s current earnings and dividend guidance.
Find out about the key risks to this Nippon Shokubai narrative.
Another View On Nippon Shokubai’s Value
While the P/E comparison makes Nippon Shokubai look expensive against peers and its fair ratio, the SWS DCF model points in the opposite direction. On that measure, the stock trades at ¥2,696.5 compared with an estimated future cash flow value of ¥3,551.43, which frames it as undervalued. Which signal do you give more weight to?
For a closer look at how this cash flow view is built and what assumptions sit behind it, Look into how the SWS DCF model arrives at its fair value.
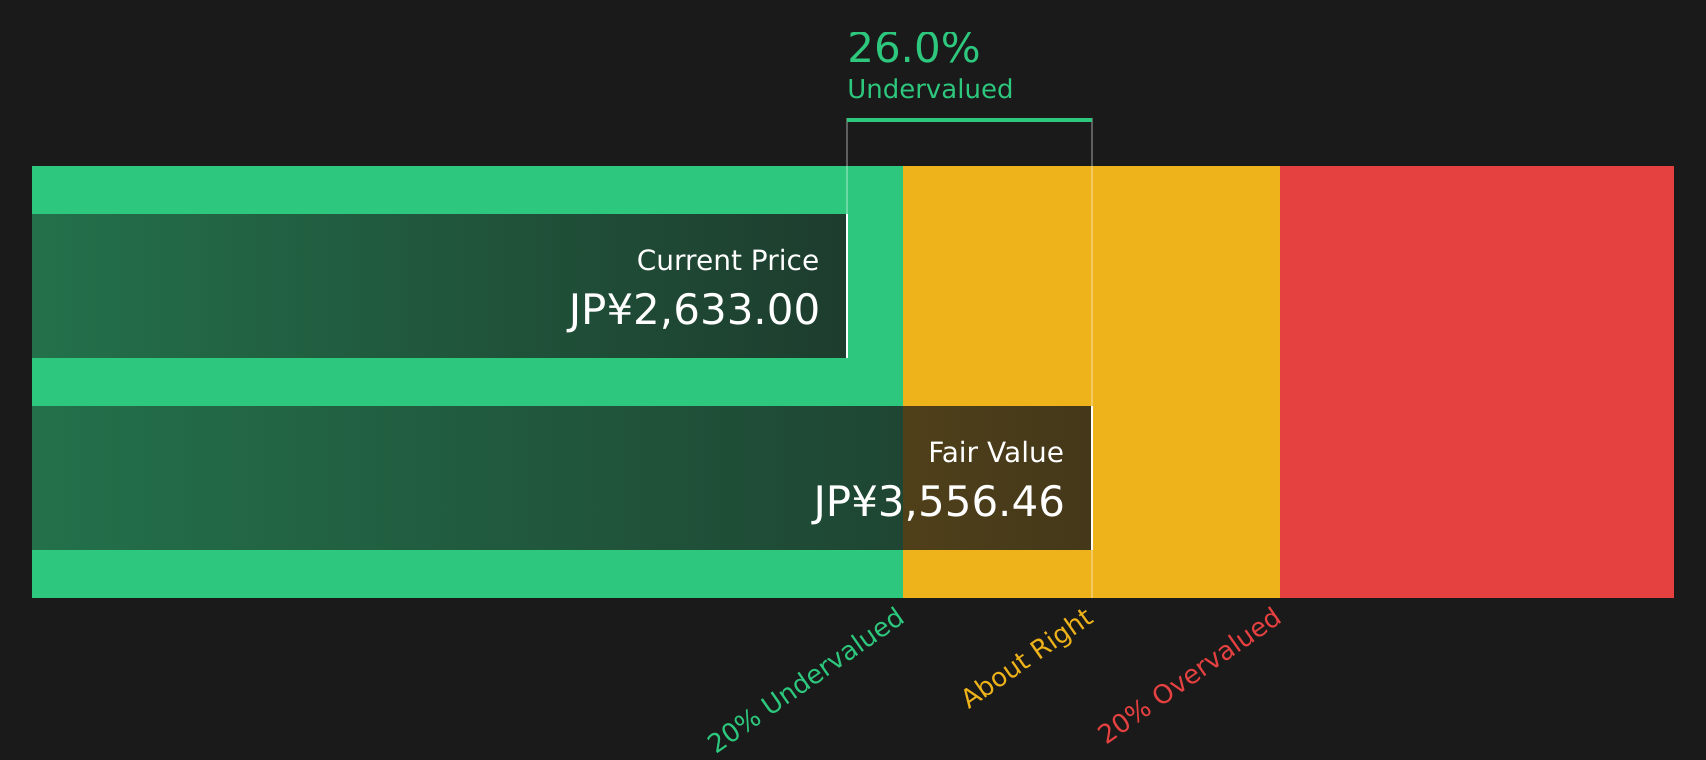
Simply Wall St performs a discounted cash flow (DCF) on every stock in the world every day (check out Nippon Shokubai for example). We show the entire calculation in full. You can track the result in your watchlist or portfolio and be alerted when this changes, or use our stock screener to discover 27 high quality undervalued stocks. If you save a screener we even alert you when new companies match - so you never miss a potential opportunity.
Next Steps
Given the mix of positives and concerns around Nippon Shokubai, it makes sense to review the details yourself and move promptly. To weigh both sides in one place, take a look at the 3 key rewards and 1 important warning sign
Looking For More Investment Ideas Beyond Nippon Shokubai?
If you are serious about building a stronger portfolio, use the Simply Wall Street Screener to quickly spot fresh ideas that match your goals and risk comfort.
- Target higher income potential by reviewing companies in the 34 dividend fortresses that focus on yields supported by underlying fundamentals.
- Identify potential value opportunities by scanning the 27 high quality undervalued stocks that combine quality metrics with attractive pricing.
- Build a more resilient portfolio foundation by focusing on the 60 resilient stocks with low risk scores that emphasise stability and lower overall risk scores.
This article by Simply Wall St is general in nature. We provide commentary based on historical data and analyst forecasts only using an unbiased methodology and our articles are not intended to be financial advice. It does not constitute a recommendation to buy or sell any stock, and does not take account of your objectives, or your financial situation. We aim to bring you long-term focused analysis driven by fundamental data. Note that our analysis may not factor in the latest price-sensitive company announcements or qualitative material. Simply Wall St has no position in any stocks mentioned.
Have feedback on this article? Concerned about the content? Get in touch with us directly. Alternatively, email editorial-team@simplywallst.com