


In the last week, the United States market has stayed flat, yet it is up 20% over the past year with earnings forecasted to grow by 17% annually. In this context of steady growth and optimistic earnings projections, identifying stocks that are potentially undervalued can offer opportunities for investors seeking to capitalize on price discrepancies.
Top 10 Undervalued Stocks Based On Cash Flows In The United States
| Name | Current Price | Fair Value (Est) | Discount (Est) |
| Wealthfront (WLTH) | $8.96 | $17.25 | 48.1% |
| Symbotic (SYM) | $40.46 | $79.16 | 48.9% |
| Sprout Social (SPT) | $9.81 | $19.05 | 48.5% |
| Southwest Airlines (LUV) | $42.49 | $84.43 | 49.7% |
| OceanFirst Financial (OCFC) | $19.56 | $38.31 | 48.9% |
| Natera (NTRA) | $311.69 | $606.24 | 48.6% |
| MercadoLibre (MELI) | $1779.14 | $3480.62 | 48.9% |
| Jacobs Solutions (J) | $142.86 | $276.29 | 48.3% |
| Gloo Holdings (GLOO) | $3.25 | $6.30 | 48.4% |
| Capri Holdings (CPRI) | $14.42 | $28.24 | 48.9% |
Below we spotlight a couple of our favorites from our exclusive screener.
Cardinal Infrastructure Group (CDNL)
Overview: Cardinal Infrastructure Group Inc. is a civil contracting company offering site development and infrastructure services across various sectors in the southeastern United States, with a market cap of $1.86 billion.
Operations: The company generates revenue primarily from its Heavy Construction segment, which accounts for $662.58 million.
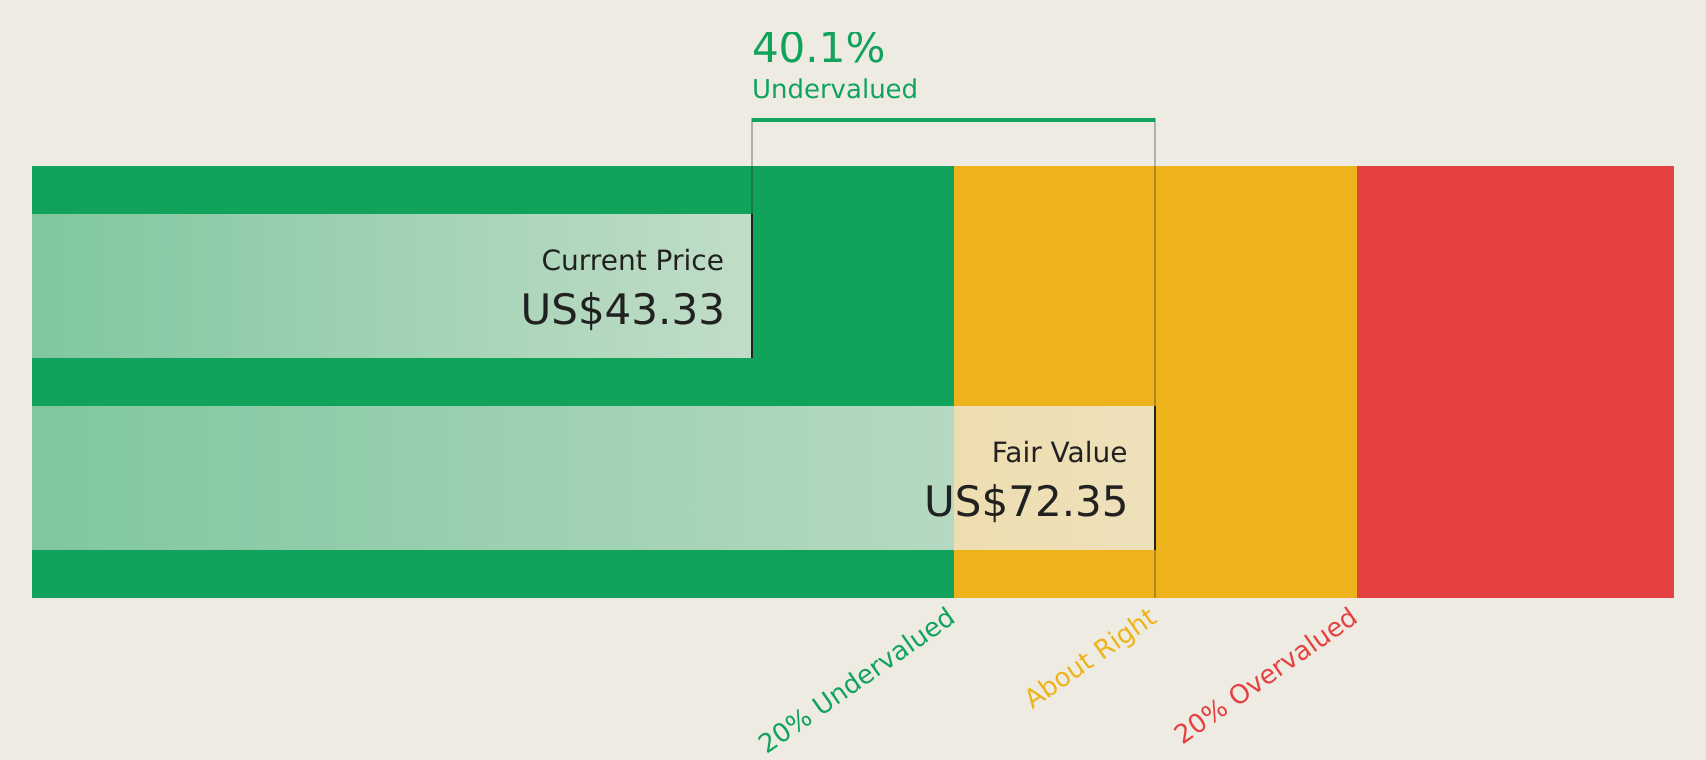
Estimated Discount To Fair Value: 36.5%
Cardinal Infrastructure Group's stock is trading at US$45.14, significantly below its estimated future cash flow value of US$71.12, suggesting it may be undervalued based on cash flows. Recent earnings guidance raised expectations for 2026 revenue to between $880-$900 million, reflecting robust growth prospects. Despite a drop from several Russell indices and a volatile share price, the company has shown substantial revenue growth and aims for profitability within three years.
- In light of our recent growth report, it seems possible that Cardinal Infrastructure Group's financial performance will exceed current levels.
- Dive into the specifics of Cardinal Infrastructure Group here with our thorough financial health report.
Micron Technology (MU)
Overview: Micron Technology, Inc. is a company that designs, develops, manufactures, and sells memory and storage products globally with a market cap of $1.06 trillion.
Operations: The company's revenue segments include the Cloud Memory Business Unit at $31.35 billion, Core Data Center Business Unit at $21.17 billion, Mobile and Client Business Unit at $27.25 billion, and Automotive and Embedded Business Unit at $10.50 billion.
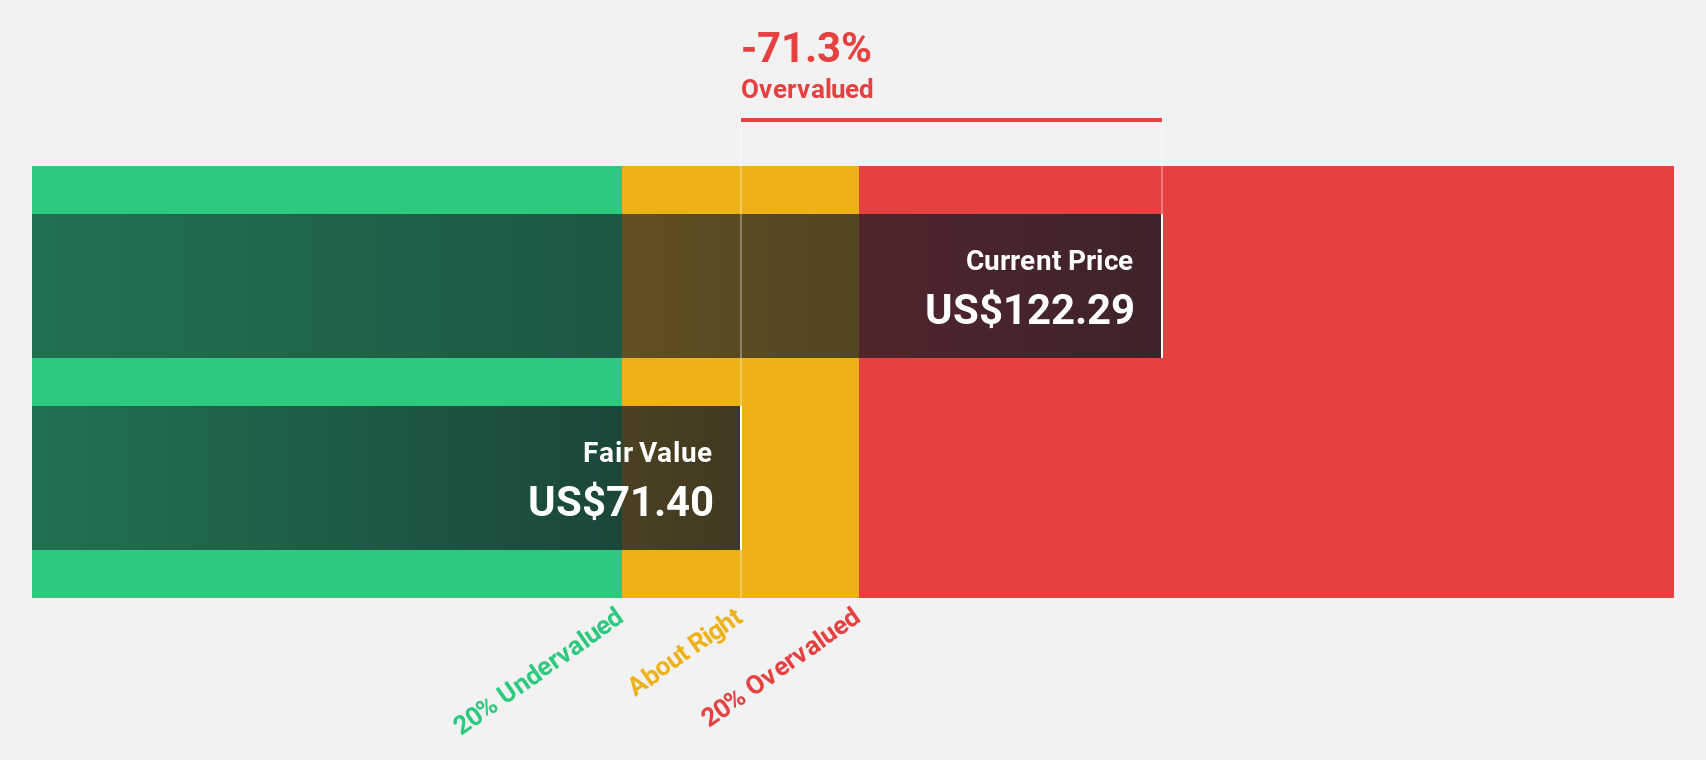
Estimated Discount To Fair Value: 12.7%
Micron Technology's stock, trading at US$940.76, is below its estimated future cash flow value of US$1077.44, reflecting a potential undervaluation based on cash flows. Despite recent legal challenges and insider selling, Micron's revenue and earnings are forecast to grow significantly faster than the market. The company is expanding its U.S. manufacturing footprint with substantial investments in AI-driven memory solutions and strategic alliances in the automotive sector to support long-term growth.
- Insights from our recent growth report point to a promising forecast for Micron Technology's business outlook.
- Unlock comprehensive insights into our analysis of Micron Technology stock in this financial health report.
Nu Holdings (NU)
Overview: Nu Holdings Ltd. operates a digital banking platform across Brazil, Mexico, Colombia, the Cayman Islands, and the United States with a market cap of $71.20 billion.
Operations: The company generates revenue primarily through its banking segment, which reported $8.44 billion.
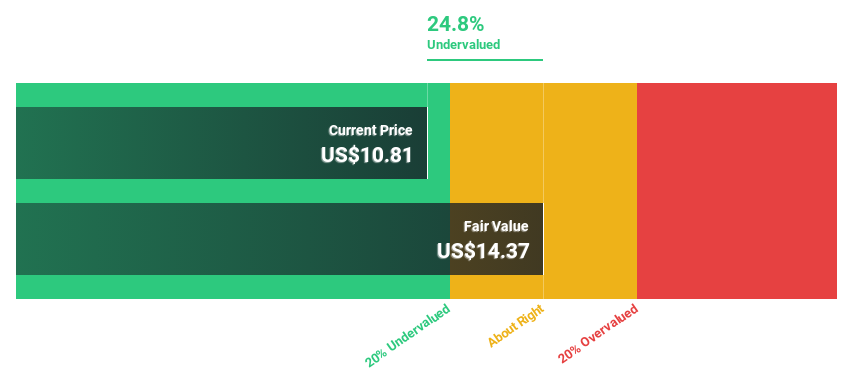
Estimated Discount To Fair Value: 17.4%
Nu Holdings, trading at $14.35, is below its estimated future cash flow value of $17.37, suggesting potential undervaluation based on cash flows. Recent earnings show significant growth with net income reaching $1.06 billion for Q2 2026, up from $636.84 million a year ago. Despite high non-performing loans at 8.6%, the company forecasts robust revenue and earnings growth surpassing market averages, supported by strategic initiatives like a $1 billion share buyback program.
- Our expertly prepared growth report on Nu Holdings implies its future financial outlook may be stronger than recent results.
- Take a closer look at Nu Holdings' balance sheet health here in our report.
Next Steps
- Gain an insight into the universe of 141 Undervalued US Stocks Based On Cash Flows by clicking here.
- Are any of these part of your asset mix? Tap into the analytical power of Simply Wall St's portfolio to get a 360-degree view on how they're shaping up.
- Unlock the power of informed investing with Simply Wall St, your free guide to navigating stock markets worldwide.
Ready For A Different Approach?
- Explore high-performing small cap companies that haven't yet garnered significant analyst attention.
- Diversify your portfolio with solid dividend payers offering reliable income streams to weather potential market turbulence.
- Fuel your portfolio with companies showing strong growth potential, backed by optimistic outlooks both from analysts and management.
This article by Simply Wall St is general in nature. We provide commentary based on historical data and analyst forecasts only using an unbiased methodology and our articles are not intended to be financial advice. It does not constitute a recommendation to buy or sell any stock, and does not take account of your objectives, or your financial situation. We aim to bring you long-term focused analysis driven by fundamental data. Note that our analysis may not factor in the latest price-sensitive company announcements or qualitative material. Simply Wall St has no position in any stocks mentioned.
Have feedback on this article? Concerned about the content? Get in touch with us directly. Alternatively, email editorial-team@simplywallst.com