


After a 278.0% total return over the past five years, ING Groep is trading at a level where investors are weighing a strong track record against valuation checks that still suggest the stock screens as inexpensive on key metrics.
- ING Groep has delivered a 278.0% return over five years, which puts extra focus on whether the current share price already reflects that performance.
- Recent moves to reduce its stake in TMBThanachart Bank and redeem certain Senior Notes can support capital efficiency, although the timing and impact of further balance sheet actions may add some uncertainty to how the market prices the stock.
- On Simply Wall St's broader checks, ING Groep scores highly on value and appears undervalued in 5 of 6 measures. This points to a market price that is below the intrinsic value estimate from the Excess Returns model 5.
The issue now is whether ING Groep's current price still offers enough upside relative to that intrinsic value estimate to appeal to new investors.
Is ING Groep a Bargain on Excess Returns?
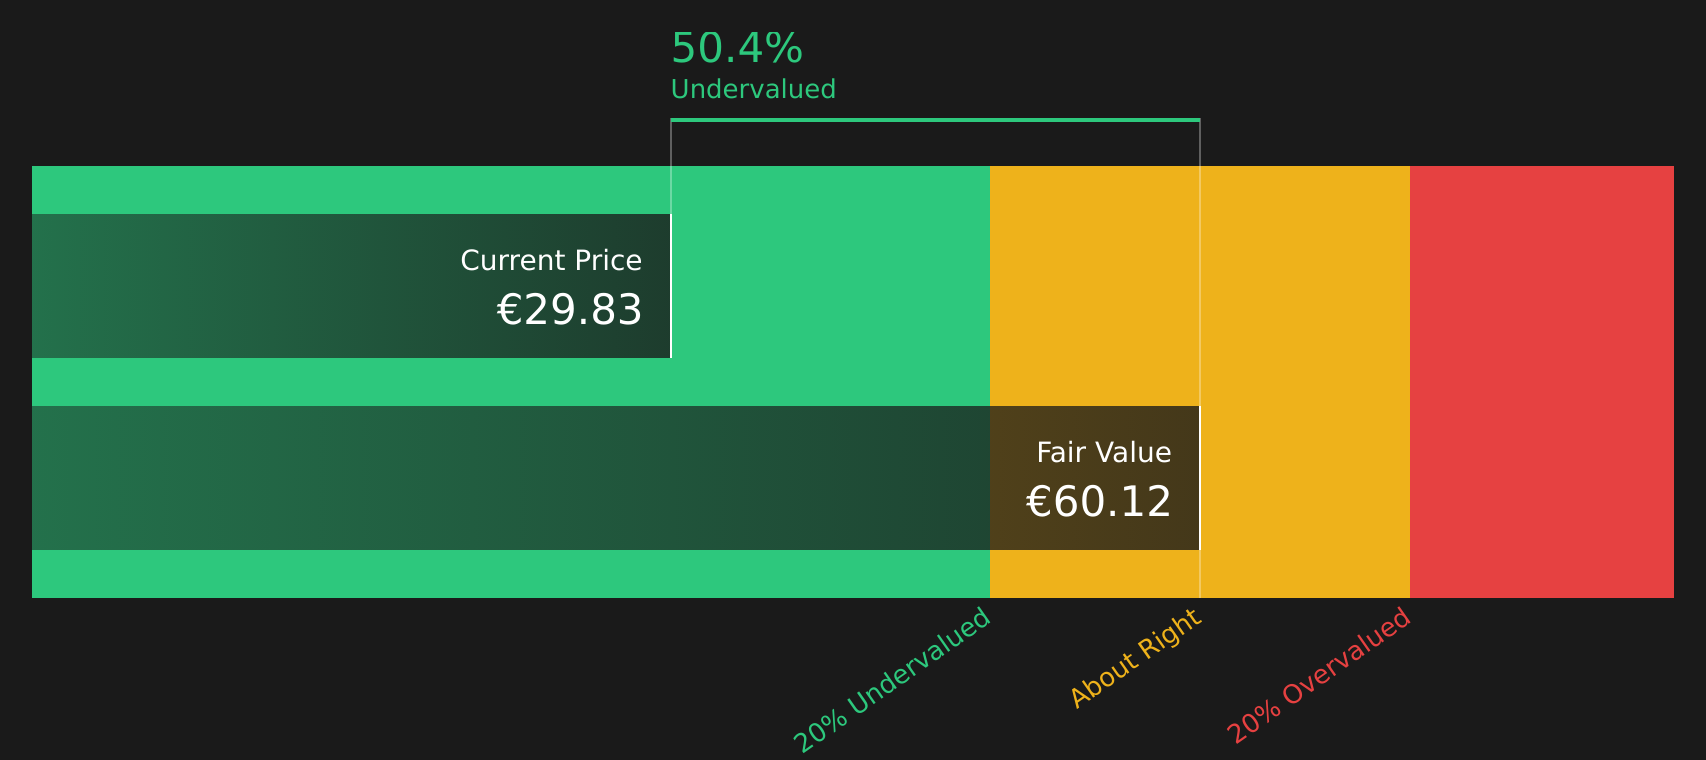
The Excess Returns model looks at how efficiently ING Groep can generate profits on its equity base over time. For ING Groep, the inputs point to returns on equity that are comfortably above the modelled cost of equity, which supports a higher intrinsic value than the current share price.
The model uses a Book Value of €17.57 per share and a Stable Book Value of €19.12 per share, with Stable EPS of €2.91 per share based on estimates from 17 analysts. Against a Cost of Equity of €1.23 per share, this produces an Excess Return of €1.68 per share and an average Return on Equity of 15.22%. On this setup, the Excess Returns valuation points to an intrinsic value of about €59.59 per share. This implies the stock is 49.9% undervalued relative to the current market price. Because ING Groep is reducing its stake in TMBThanachart Bank, the market may still be adjusting to how these capital moves affect the long term earnings base.
On these Excess Returns assumptions, ING Groep screens as clearly undervalued compared with its estimated intrinsic value.
Our Excess Returns analysis suggests ING Groep is undervalued by 49.9%. Track this in your watchlist or portfolio, or discover 278 more high quality undervalued stocks.
Is ING Groep a Bargain on Earnings?
P/E works well for ING Groep because earnings are a key focus for banks. On this measure, ING Groep trades on a P/E of 9.8x. That is below both the wider banks industry average of 11.5x and the peer group average of 15.0x. It also sits under the tailored fair P/E ratio of 11.6x that reflects the company’s size, profitability profile and risk factors.
The gap between ING Groep's current P/E and the fair ratio suggests the market price does not fully reflect the earnings implied by recent analyst estimates. For investors who like to anchor decisions on straightforward earnings multiples, this points to a stock that screens below what many comparable banks trade on today.
On the P/E multiple, ING Groep stock appears inexpensive relative to both its tailored fair ratio and banking peers.

See what the numbers say about this price — find out in our valuation breakdown.
The ING Groep Narrative: What Would Justify Today's Price?
Simply Wall St Narratives for ING Groep pick up where the valuation puzzle leaves off. They spell out which paths for future growth, margins and earnings would need to hold for the stock to be worth materially more or less than today’s price. Each one links its number to a clear view on how ING Groep's growth, profitability and risk profile could evolve, which you can revisit as new information is released.
Share a narrative on ING Groep that lays out your numbers-driven view on whether moves like the TMBThanachart Bank stake reduction and upcoming Senior Notes redemptions support the current share price or point to a different outcome.
Add your voice to the Simply Wall St community and set out a thesis that can be tracked as ING Groep's results and capital actions unfold.
Do you think there's more to the story for ING Groep? Head over to our Community to see what others are saying!
The Bottom Line
ING Groep screens as undervalued on both the Excess Returns intrinsic value estimate and on earnings multiples, which point in the same direction even after the strong five year outcome. That kind of alignment across methods suggests the current discount is more about market expectations and sentiment than about the underlying earnings base. The key question from here is whether ING Groep can sustain returns on equity and capital discipline, including actions such as stake reductions and note redemptions, in a way that eventually narrows that valuation gap rather than leaving it as a value trap.
This article by Simply Wall St is general in nature. We provide commentary based on historical data and analyst forecasts only using an unbiased methodology and our articles are not intended to be financial advice. It does not constitute a recommendation to buy or sell any stock, and does not take account of your objectives, or your financial situation. We aim to bring you long-term focused analysis driven by fundamental data. Note that our analysis may not factor in the latest price-sensitive company announcements or qualitative material. Simply Wall St has no position in any stocks mentioned.
Have feedback on this article? Concerned about the content? Get in touch with us directly. Alternatively, email editorial-team@simplywallst.com