


As global markets navigate a mix of easing inflation concerns, fluctuating oil prices, and geopolitical uncertainties, investors are keenly observing the performance of major indices. With the S&P 500 posting modest gains and the Russell 2000 showing stronger performance amidst these conditions, identifying stocks trading below their intrinsic value presents a compelling opportunity for those looking to capitalize on market inefficiencies. In such an environment, undervalued stocks with strong fundamentals can offer potential growth prospects as they may be poised to benefit from improving economic indicators and sector-specific trends.
Top 10 Undervalued Stocks Based On Cash Flows
| Name | Current Price | Fair Value (Est) | Discount (Est) |
| Shengda ResourcesLtd (SZSE:000603) | CN¥36.61 | CN¥72.84 | 49.7% |
| Sansha Electric ManufacturingLtd (TSE:6882) | ¥1174.00 | ¥2342.80 | 49.9% |
| Nexstim (HLSE:NXTMH) | €9.08 | €18.09 | 49.8% |
| Mips (OM:MIPS) | SEK378.40 | SEK752.71 | 49.7% |
| Mare Group (BIT:MARE) | €4.95 | €9.89 | 50% |
| Huatu Cendes (SZSE:300492) | CN¥23.72 | CN¥47.28 | 49.8% |
| Hanwha Engine (KOSE:A082740) | ₩44050.00 | ₩87594.14 | 49.7% |
| Dustin Group (OM:DUST) | SEK1.74 | SEK3.47 | 49.8% |
| DEUTZ (XTRA:DEZ) | €10.07 | €20.13 | 50% |
| BAWAG Group (WBAG:BG) | €173.00 | €345.15 | 49.9% |
Here we highlight a subset of our preferred stocks from the screener.
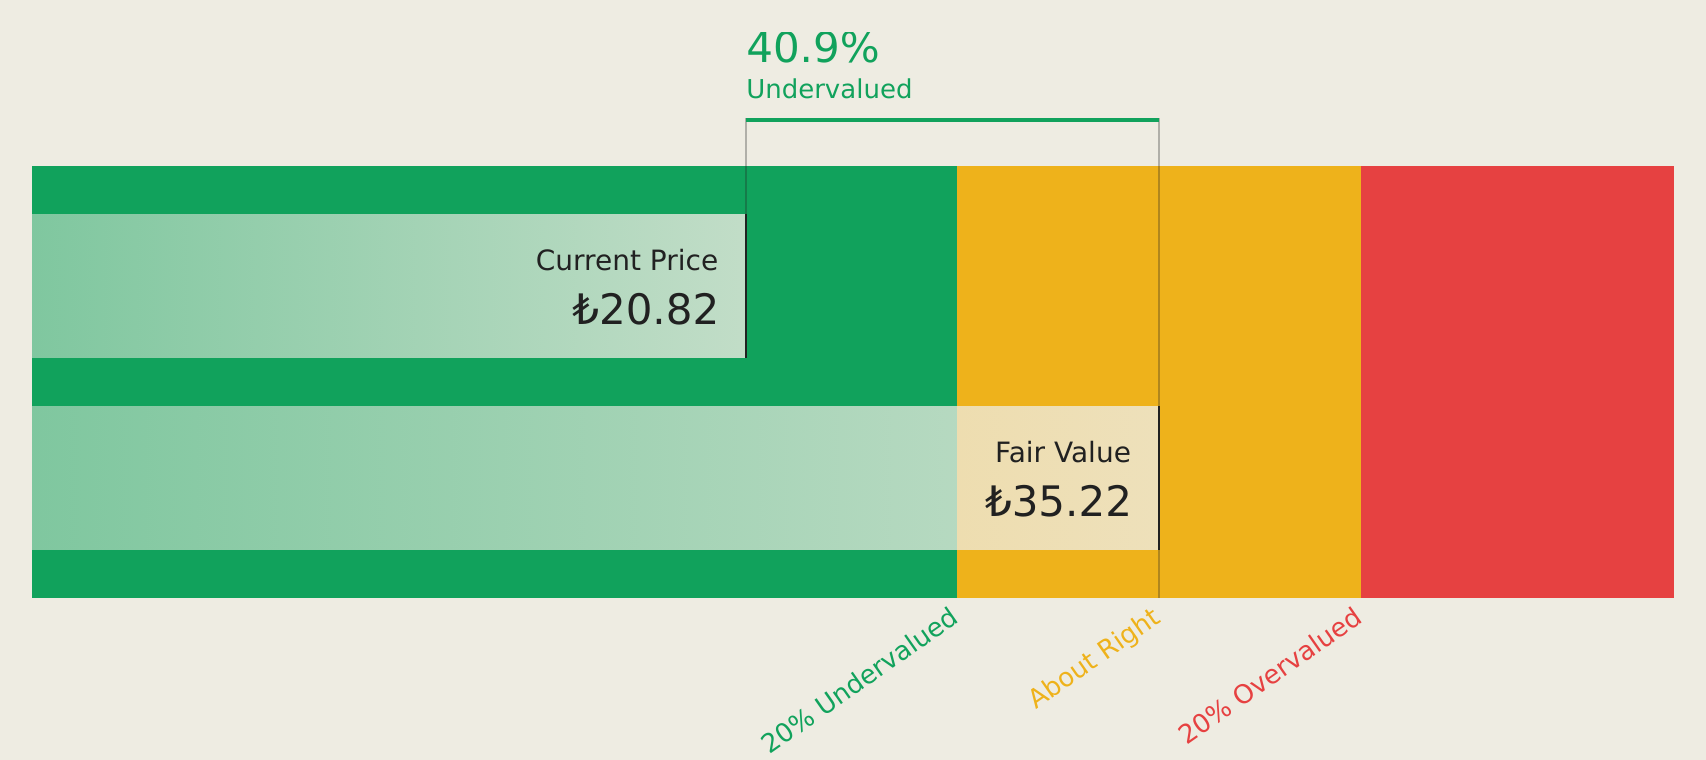
OYAK Çimento Fabrikalari (IBSE:OYAKC)
Overview: OYAK Çimento Fabrikalari A.S., along with its subsidiaries, is involved in the production and sale of clinker and cement in Turkey, with a market capitalization of TRY107.64 billion.
Operations: The company's revenue segments include Cement, generating TRY34.21 billion, and Ready-Mixed Concrete, contributing TRY18.48 billion.
Estimated Discount To Fair Value: 44.8%
OYAK Çimento Fabrikalari is trading at TRY22.14, significantly below its estimated future cash flow value of TRY40.08, indicating potential undervaluation. Despite recent declines in revenue and net income for the second quarter and six months ending June 2026, earnings are forecast to grow substantially at 55.9% annually over the next three years, outpacing the Turkish market's growth rate. However, its dividend yield of 4.52% is not well covered by free cash flows.
- Our growth report here indicates OYAK Çimento Fabrikalari may be poised for an improving outlook.
- Unlock comprehensive insights into our analysis of OYAK Çimento Fabrikalari stock in this financial health report.
Dekon Food and Agriculture Group (SEHK:2419)
Overview: Dekon Food and Agriculture Group operates in the livestock and poultry breeding and farming sectors, with a market cap of HK$20.79 billion.
Operations: Dekon Food and Agriculture Group generates its revenue from livestock and poultry breeding and farming activities.
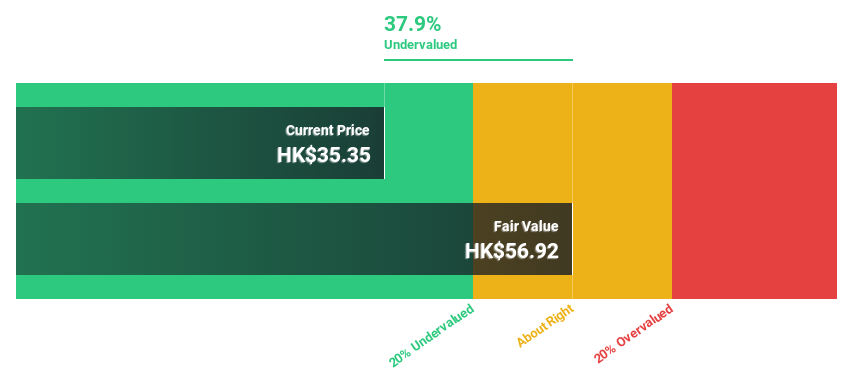
Estimated Discount To Fair Value: 38%
Dekon Food and Agriculture Group, trading at HK$53.95, is valued below its estimated future cash flow value of HK$87.01, suggesting it may be undervalued. Despite a recent net loss of CNY 1,158.78 million for the half year ending June 2026 and declining sales from the previous year, earnings are anticipated to grow by 91.3% annually over three years. Analysts expect profitability within three years with revenue growth outpacing the Hong Kong market average.
- In light of our recent growth report, it seems possible that Dekon Food and Agriculture Group's financial performance will exceed current levels.
- Dive into the specifics of Dekon Food and Agriculture Group here with our thorough financial health report.
Shengda ResourcesLtd (SZSE:000603)
Overview: Shengda Resources Co., Ltd., with a market cap of CN¥22.78 billion, operates through its subsidiaries in the mining, beneficiation, and sale of precious and non-ferrous metal ores in China.
Operations: Shengda Resources Co., Ltd. generates revenue primarily through its subsidiaries' activities in mining, processing, and selling precious and non-ferrous metal ores within China.
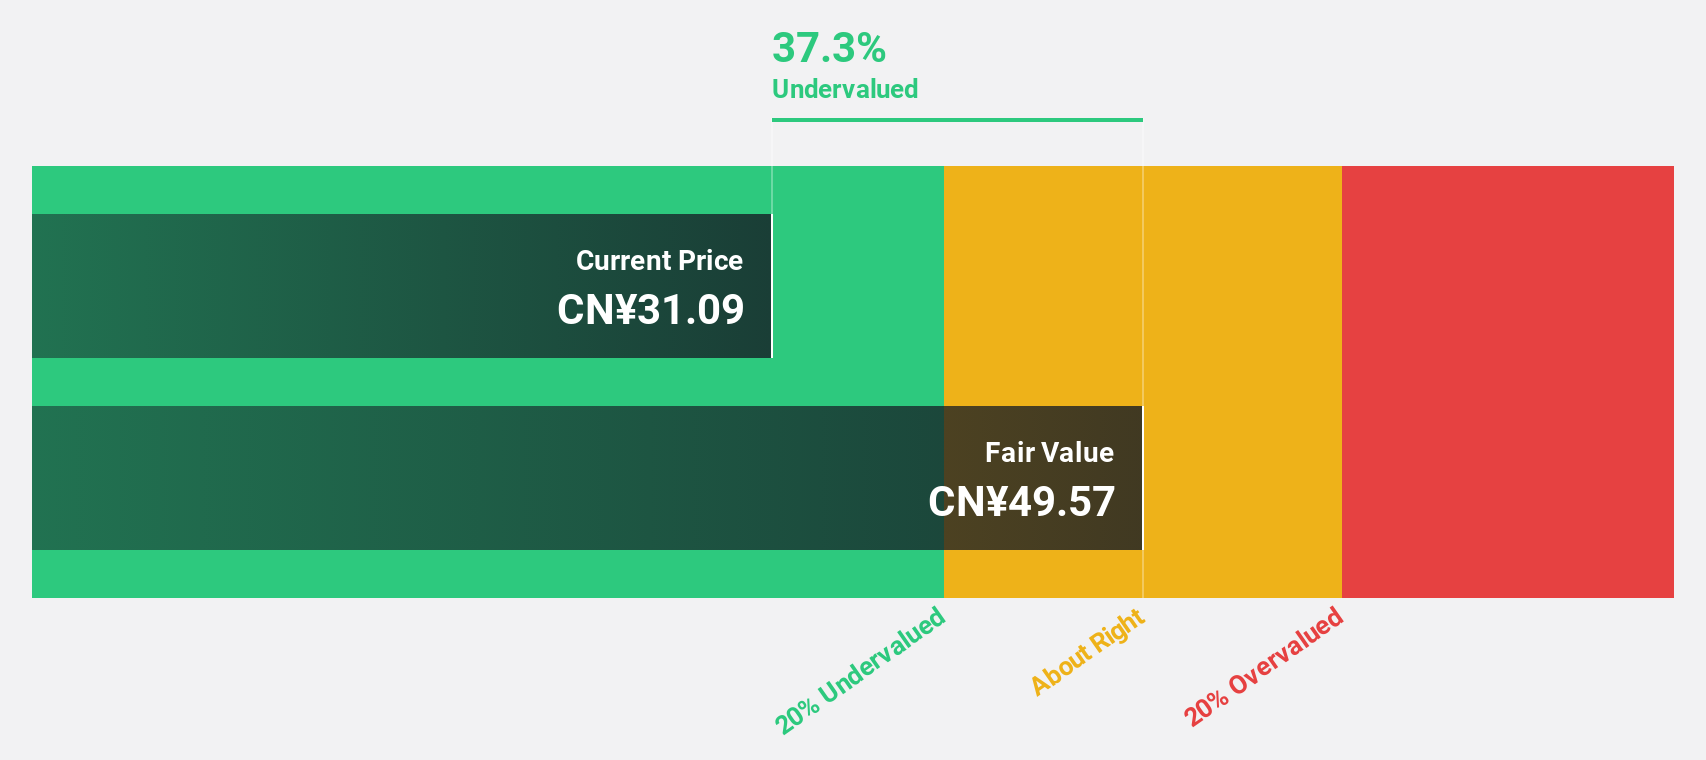
Estimated Discount To Fair Value: 49.7%
Shengda Resources Ltd., trading at CN¥36.61, is significantly undervalued with an estimated future cash flow value of CN¥72.84. Recent earnings for the half-year ended June 2026 show a substantial rise in net income to CN¥390.06 million from CN¥70.1 million the previous year, alongside revenue growth to CN¥1.15 billion from CN¥906.17 million. Earnings and revenue are forecasted to grow annually by over 31% and 33%, respectively, outpacing market averages in China.
- Insights from our recent growth report point to a promising forecast for Shengda ResourcesLtd's business outlook.
- Get an in-depth perspective on Shengda ResourcesLtd's balance sheet by reading our health report here.
Make It Happen
- Access the full spectrum of 464 Undervalued Global Stocks Based On Cash Flows by clicking on this link.
- Already own these companies? Link your portfolio to Simply Wall St and get alerts on any new warning signs to your stocks.
- Discover a world of investment opportunities with Simply Wall St's free app and access unparalleled stock analysis across all markets.
Interested In Other Possibilities?
- Explore high-performing small cap companies that haven't yet garnered significant analyst attention.
- Diversify your portfolio with solid dividend payers offering reliable income streams to weather potential market turbulence.
- Fuel your portfolio with companies showing strong growth potential, backed by optimistic outlooks both from analysts and management.
This article by Simply Wall St is general in nature. We provide commentary based on historical data and analyst forecasts only using an unbiased methodology and our articles are not intended to be financial advice. It does not constitute a recommendation to buy or sell any stock, and does not take account of your objectives, or your financial situation. We aim to bring you long-term focused analysis driven by fundamental data. Note that our analysis may not factor in the latest price-sensitive company announcements or qualitative material. Simply Wall St has no position in any stocks mentioned.
Have feedback on this article? Concerned about the content? Get in touch with us directly. Alternatively, email editorial-team@simplywallst.com