


What VGP’s Latest Half Year Earnings Tell Investors
VGP (ENXTBR:VGP) recently reported half year 2026 results that combined higher sales with lower profitability, giving investors a fresh data point on how the logistics real estate specialist is performing.
Sales for the six months to 30 June 2026 were €49.69 million compared with €45.56 million a year earlier, while net income declined to €119.79 million from €180.53 million over the same period.
Basic and diluted earnings per share from continuing operations were €4.26, down from €6.61 a year ago, which helps explain why the stock’s recent move has attracted renewed attention from existing and potential VGP shareholders.
See our latest analysis for VGP.
The latest half year report seems to have shifted sentiment only modestly, with a 1 day share price return of 2.92% at €81.10 and a year to date share price return that declined 16.65%, while the 5 year total shareholder return fell 49.55%. This suggests longer term momentum has faded even though recent daily moves have been more supportive.
If this mix of short term swings and longer term pressure has you reassessing your portfolio, it can be useful to broaden the search and look at 39 power grid technology and infrastructure stocks
VGP’s share price has firmed up in the past week even though earnings per share fell on the latest half year numbers. Does that move already reflect the company’s value, or is it more sensible to wait for a better entry point before doing the valuation work?
Preferred P/E of 10.7x for VGP: Is it justified?
On valuation, VGP is currently on a P/E of 10.7x, which looks modest when set against both its peers and an internal estimate of fair value for that multiple.
The P/E ratio compares the company’s share price to its earnings per share. It shows how much investors are paying for each unit of current earnings. For a logistics and industrial real estate group like VGP, this is a common way for the market to weigh up present profits against expectations for future income and cash generation.
VGP’s P/E of 10.7x sits below the European Real Estate industry average of 12x and below a peer group average of 23.8x. It is also below an estimated fair P/E of 22x, which marks out a level the market could potentially move towards if sentiment and earnings expectations align more closely with that benchmark.
Explore the SWS fair ratio for VGP
Result: Price-to-earnings of 10.7x (UNDERVALUED)
However, the VGP story also carries risks, including prolonged share price weakness over 1 and 5 years, as well as any pressure on rental demand across its European logistics portfolio.
Find out about the key risks to this VGP narrative.
Another View on VGP’s Value Using the SWS DCF Model
While VGP’s 10.7x P/E suggests room compared with peers and the fair ratio, the SWS DCF model points the other way. On this view, the stock at €81.10 trades above an estimated value of €76.58, which frames it as overvalued rather than discounted. Which approach do you trust more for your own process?
Look into how the SWS DCF model arrives at its fair value.
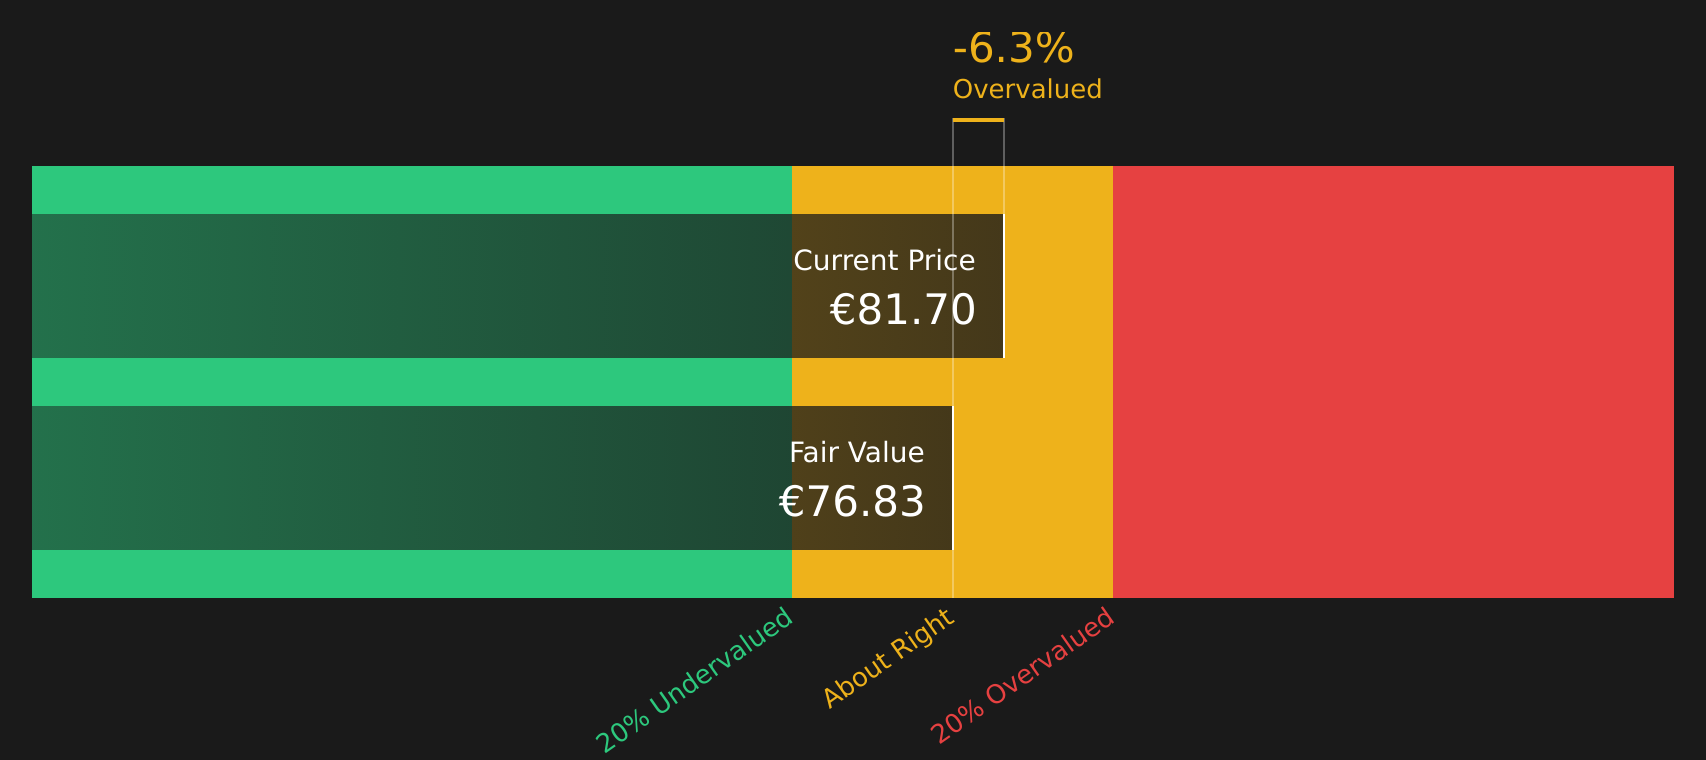
Simply Wall St performs a discounted cash flow (DCF) on every stock in the world every day (check out VGP for example). We show the entire calculation in full. You can track the result in your watchlist or portfolio and be alerted when this changes, or use our stock screener to discover 267 high quality undervalued stocks. If you save a screener we even alert you when new companies match - so you never miss a potential opportunity.
Next Steps
Given the mixed signals around VGP, it makes sense to look past the headline moves and test the numbers yourself before acting. To see both the concerns and the potential upsides side by side, review the 4 key rewards and 4 important warning signs.
Looking For More Investment Ideas Beyond VGP?
If VGP has you rethinking your next move, this is the moment to widen the lens and scan other opportunities before the market prices them more efficiently.
- Target stronger long term potential by reviewing companies that screen as 267 high quality undervalued stocks based on a blend of quality metrics and pricing.
- Build a steadier income stream by focusing on 423 dividend fortresses that may complement or balance a position in VGP.
- Strengthen portfolio resilience by concentrating on 291 resilient stocks with low risk scores that aim to keep volatility in check while you assess new ideas.
This article by Simply Wall St is general in nature. We provide commentary based on historical data and analyst forecasts only using an unbiased methodology and our articles are not intended to be financial advice. It does not constitute a recommendation to buy or sell any stock, and does not take account of your objectives, or your financial situation. We aim to bring you long-term focused analysis driven by fundamental data. Note that our analysis may not factor in the latest price-sensitive company announcements or qualitative material. Simply Wall St has no position in any stocks mentioned.
Have feedback on this article? Concerned about the content? Get in touch with us directly. Alternatively, email editorial-team@simplywallst.com