


As global markets navigate a landscape marked by inflation concerns and geopolitical tensions, Asian equities present a unique opportunity for investors seeking value. In this environment, identifying stocks priced below their estimated value can be a strategic approach to potentially capitalize on market inefficiencies and unlock growth potential.
Top 10 Undervalued Stocks Based On Cash Flows In Asia
| Name | Current Price | Fair Value (Est) | Discount (Est) |
| Winall Hi-tech Seed (SZSE:300087) | CN¥5.47 | CN¥10.84 | 49.5% |
| SK oceanplantLtd (KOSE:A100090) | ₩13030.00 | ₩25477.29 | 48.9% |
| Shengda ResourcesLtd (SZSE:000603) | CN¥36.61 | CN¥73.20 | 50% |
| Sansha Electric ManufacturingLtd (TSE:6882) | ¥1174.00 | ¥2344.06 | 49.9% |
| Mao Geping Cosmetics (SEHK:1318) | HK$50.65 | HK$98.70 | 48.7% |
| Loncin Motor (SHSE:603766) | CN¥13.86 | CN¥27.24 | 49.1% |
| Huatu Cendes (SZSE:300492) | CN¥23.72 | CN¥47.26 | 49.8% |
| Hanwha Engine (KOSE:A082740) | ₩44100.00 | ₩87483.04 | 49.6% |
| Delton Technology (Guangzhou) (SZSE:001389) | CN¥155.95 | CN¥305.73 | 49% |
| Akeso (SEHK:9926) | HK$90.25 | HK$178.80 | 49.5% |
Let's uncover some gems from our specialized screener.
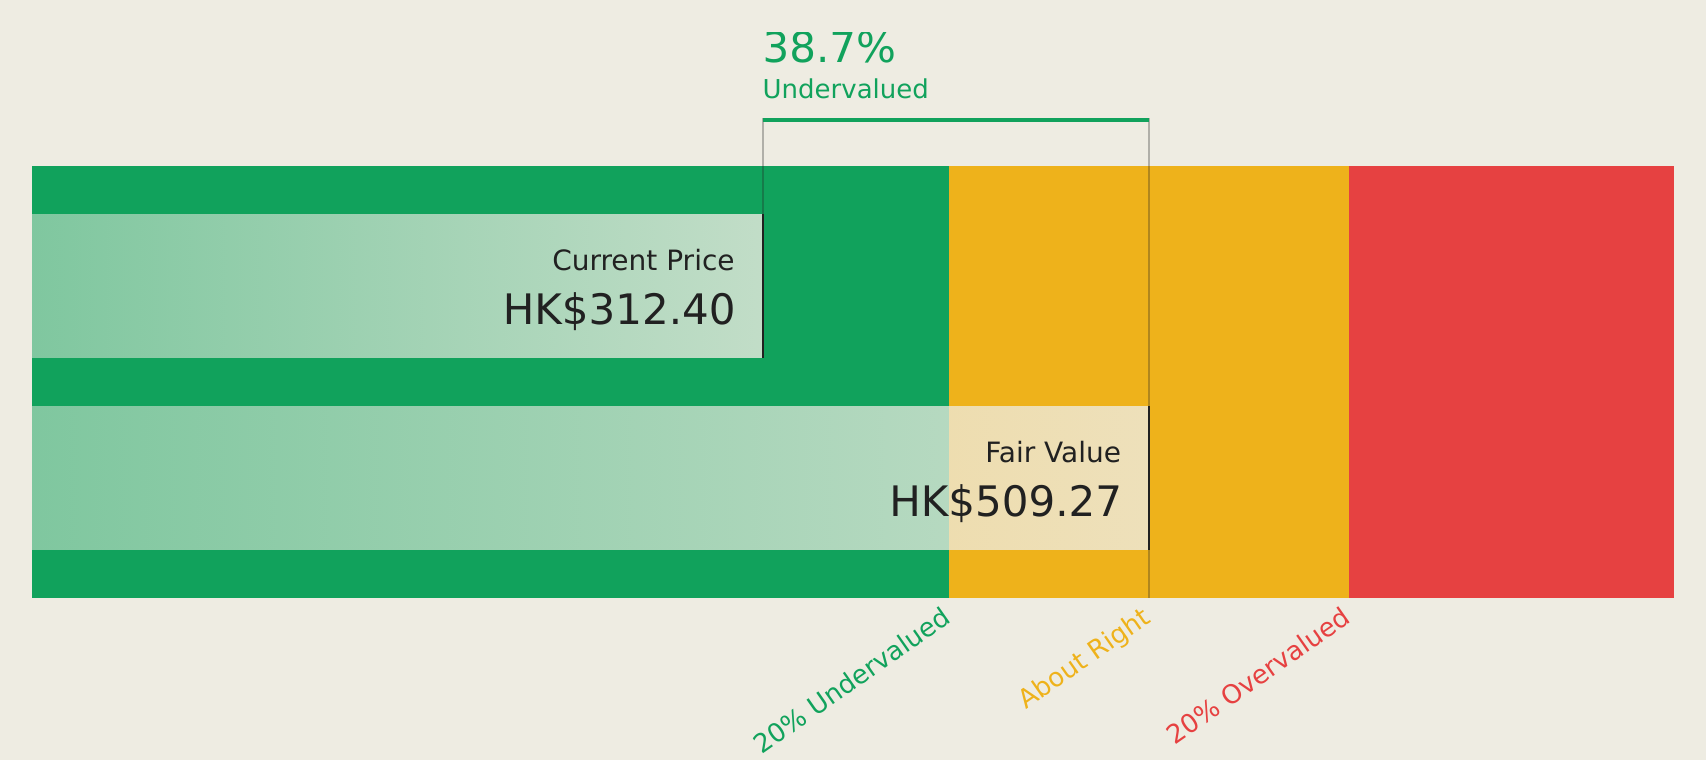
Sigenergy Technology (SEHK:6656)
Overview: Sigenergy Technology Co., Ltd specializes in developing and manufacturing energy storage systems, inverters, and smart energy solutions for residential, commercial, and industrial use with a market cap of HK$84.90 billion.
Operations: The company's revenue primarily comes from its Batteries / Battery Systems segment, which generated CN¥9 billion.
Estimated Discount To Fair Value: 33.4%
Sigenergy Technology is trading 33.4% below its estimated fair value, with a current price of HK$341.2 against a future cash flow value of HK$512.12, indicating potential undervaluation based on cash flows. The company forecasts substantial revenue growth at 29.3% annually and earnings growth at 32.7%, outpacing the Hong Kong market significantly. Recent guidance confirmed robust financial performance with expected revenue and profit increases between 240-270% and 190-210%, respectively, compared to the previous year.
- Insights from our recent growth report point to a promising forecast for Sigenergy Technology's business outlook.
- Navigate through the intricacies of Sigenergy Technology with our comprehensive financial health report here.
Loncin Motor (SHSE:603766)
Overview: Loncin Motor Co., Ltd. manufactures and sells generating sets, agricultural machinery equipment, light-duty power units, and two-wheeled motorcycles in Japan and internationally, with a market cap of CN¥28.46 billion.
Operations: The company's revenue segments include generating sets, agricultural machinery equipment, light-duty power units, and two-wheeled motorcycles sold both domestically and internationally.
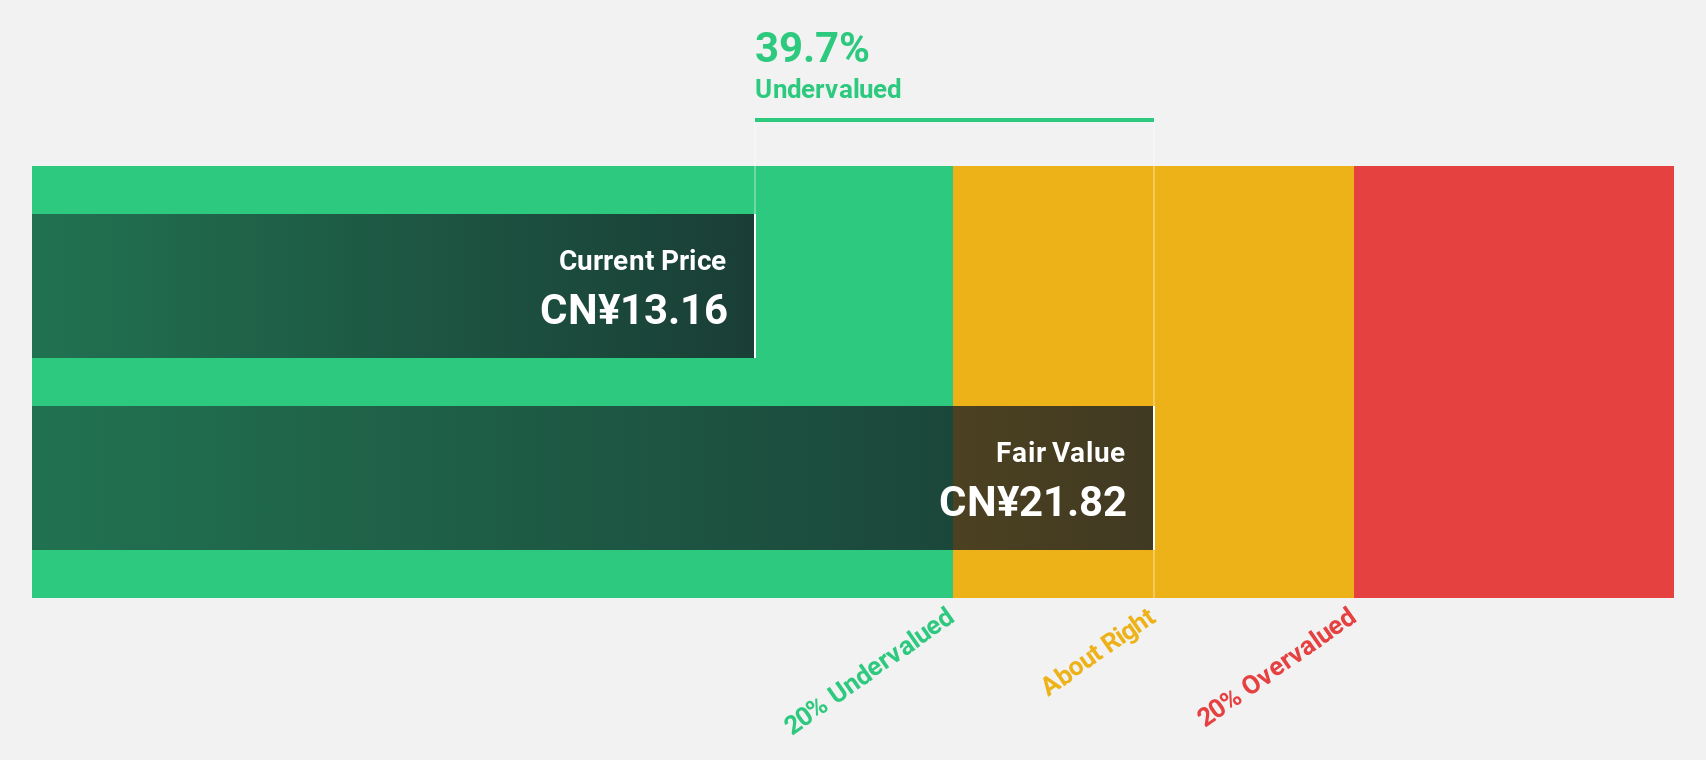
Estimated Discount To Fair Value: 49.1%
Loncin Motor is trading at CN¥13.86, significantly below its estimated future cash flow value of CN¥27.24, highlighting potential undervaluation. Despite forecasted revenue growth of 17.8% annually and earnings growth of 25.59%, both are slightly below the Chinese market averages. Recent earnings reports show a slight decline in net income to CN¥991.21 million from CN¥1,074.22 million year-on-year, with dividends not fully covered by earnings at 5.05%.
- The growth report we've compiled suggests that Loncin Motor's future prospects could be on the up.
- Take a closer look at Loncin Motor's balance sheet health here in our report.
BizLink Holding (TWSE:3665)
Overview: BizLink Holding Inc., along with its subsidiaries, offers connection harness application solutions across various regions including the United States, China, and Europe, with a market cap of NT$444.26 billion.
Operations: The company's revenue is primarily derived from its Computer Transmission segment at NT$105.75 billion, followed by the Industrial Application Segment at NT$25.79 billion and the Home Appliance Segment at NT$8.17 billion.
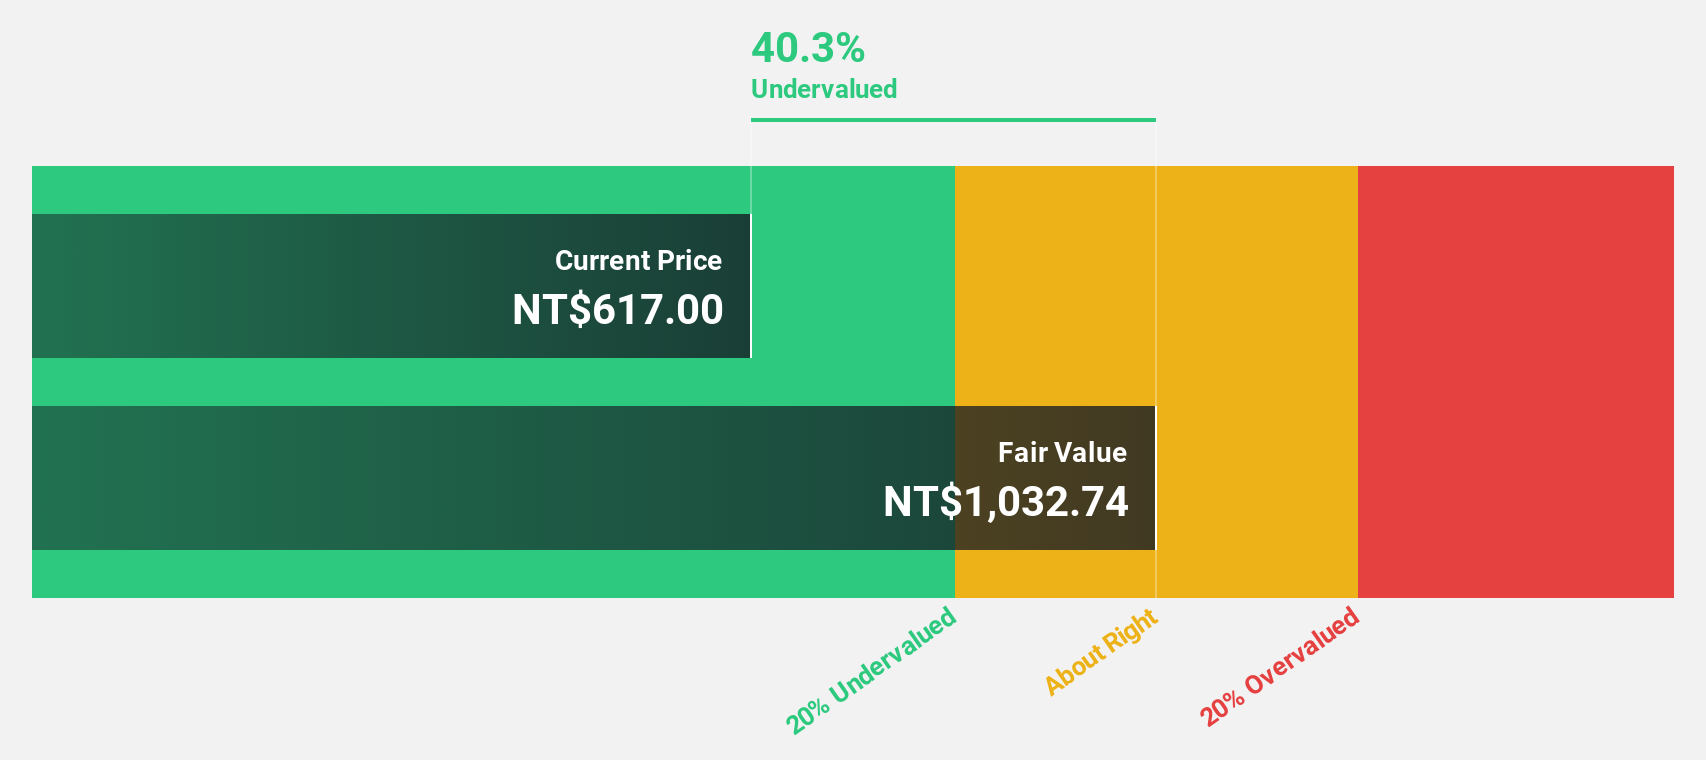
Estimated Discount To Fair Value: 27.3%
BizLink Holding's current trading price of NT$2275 is considerably below its estimated future cash flow value of NT$3128.18, suggesting substantial undervaluation. The company forecasts robust revenue growth at 29.9% annually, outpacing the Taiwan market average. Earnings are expected to rise by nearly 40% per year, also exceeding the market rate. Recent financial activities include a $500 million zero-coupon convertible bond offering and a $315.14 million follow-on equity issuance through Global Depositary Receipts.
- Our growth report here indicates BizLink Holding may be poised for an improving outlook.
- Get an in-depth perspective on BizLink Holding's balance sheet by reading our health report here.
Where To Now?
- Click through to start exploring the rest of the 215 Undervalued Asian Stocks Based On Cash Flows now.
- Got skin in the game with these stocks? Elevate how you manage them by using Simply Wall St's portfolio, where intuitive tools await to help optimize your investment outcomes.
- Streamline your investment strategy with Simply Wall St's app for free and benefit from extensive research on stocks across all corners of the world.
Ready To Venture Into Other Investment Styles?
- Explore high-performing small cap companies that haven't yet garnered significant analyst attention.
- Diversify your portfolio with solid dividend payers offering reliable income streams to weather potential market turbulence.
- Fuel your portfolio with companies showing strong growth potential, backed by optimistic outlooks both from analysts and management.
This article by Simply Wall St is general in nature. We provide commentary based on historical data and analyst forecasts only using an unbiased methodology and our articles are not intended to be financial advice. It does not constitute a recommendation to buy or sell any stock, and does not take account of your objectives, or your financial situation. We aim to bring you long-term focused analysis driven by fundamental data. Note that our analysis may not factor in the latest price-sensitive company announcements or qualitative material. Simply Wall St has no position in any stocks mentioned.
Have feedback on this article? Concerned about the content? Get in touch with us directly. Alternatively, email editorial-team@simplywallst.com