


T. Rowe Price Group stock has delivered a decline of 37.1% over the past 5 years, yet its current checks point to shares trading at a discount to an intrinsic value estimate based on the Excess Returns model and to market based multiples. For investors, the question is whether the recent news on acquisitions and new business initiatives is enough to justify what these valuation frameworks are implying.
- The 37.1% decline over 5 years leaves long term shareholders under water and sets a low base for any future rerating in T. Rowe Price Group.
- The planned acquisition of fixed income specialist F/m Investments and the push into AI and crypto related capabilities can support expectations for future cash flows, while execution risk around integrating new platforms and scaling newer areas of the business may weigh on how much of that value is ultimately realized.
- T. Rowe Price Group screens as undervalued on most checks, with a high value score of 5 out of 6, which suggests the broader assessment leans cheap rather than fully priced.
The issue now is whether that apparent discount to intrinsic value and earnings based metrics offers enough compensation for the risks around execution in fixed income, AI and digital assets.
Find out why T. Rowe Price Group's 10.0% return over the last year is lagging behind its peers.
Does T. Rowe Price Group Look Undervalued on Excess Returns?
The Excess Returns model looks at how much value T. Rowe Price Group can create above its cost of equity. It focuses on the earnings the company can generate from its equity base rather than only near term cash flows.
For T. Rowe Price Group, the model uses a Book Value of $51.58 per share and a Stable EPS of $9.96 per share, based on future Return on Equity estimates from 5 analysts. With a Cost of Equity of $4.17 per share and an Excess Return of $5.79 per share, this implies the company is expected to earn well above its equity charge on an Average Return on Equity of 18.85%. The Stable Book Value is $52.85 per share, based on estimates from 3 analysts.
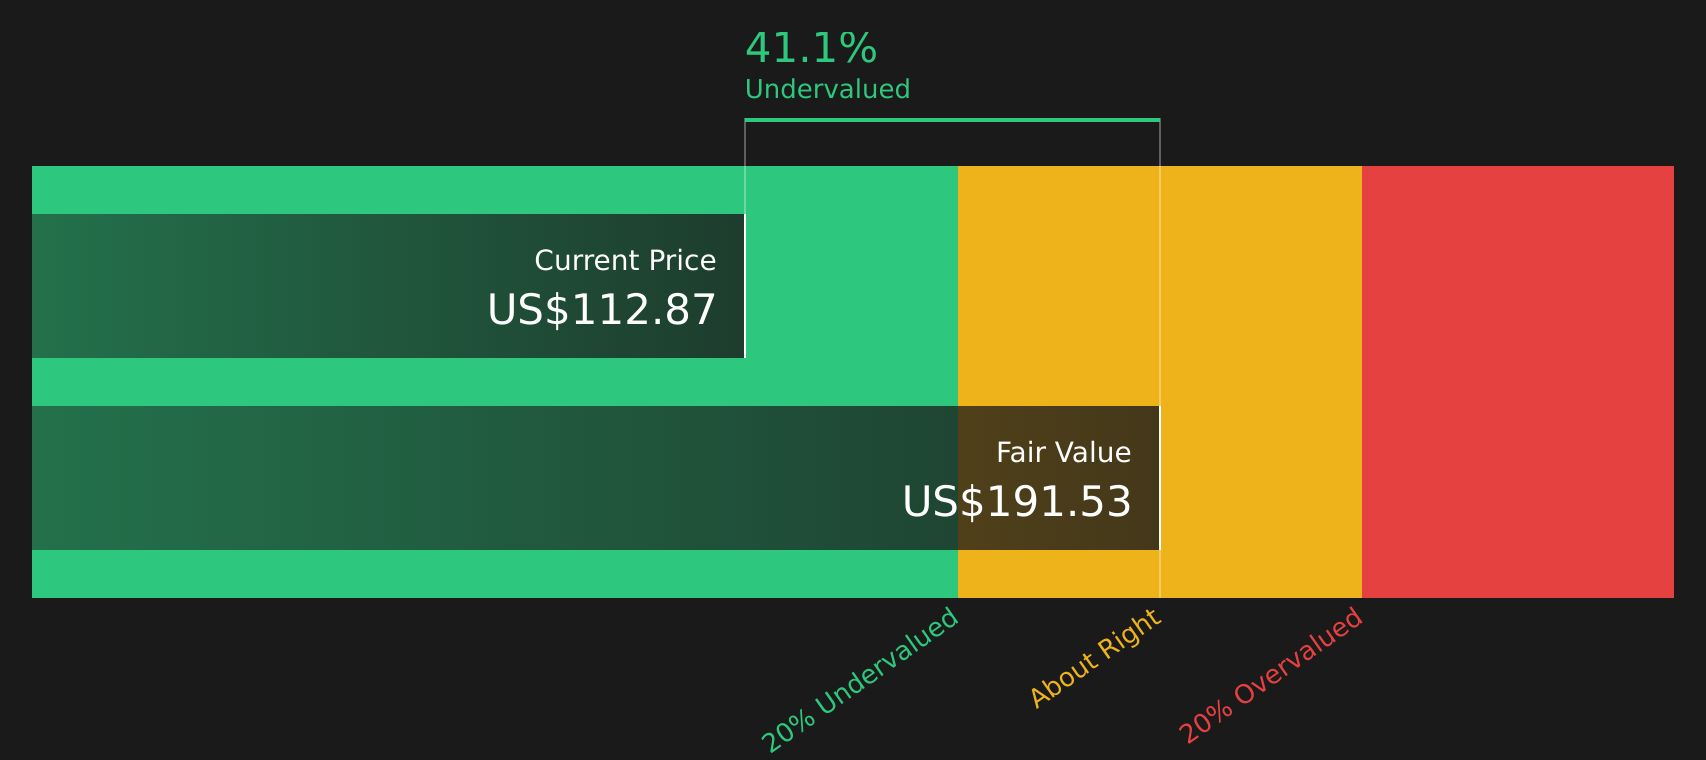
Based on these inputs, the Excess Returns framework points to an intrinsic value of about $191 per share, which is 41.2% above the current share price, so the stock screens as undervalued. The planned acquisition of F/m Investments helps explain why the market is watching execution risk even while the model points to solid excess returns.
On balance, the Excess Returns model suggests T. Rowe Price Group stock currently looks undervalued.
Our Excess Returns analysis suggests T. Rowe Price Group is undervalued by 41.2%. Track this in your watchlist or portfolio, or discover 49 more high quality undervalued stocks.
Is T. Rowe Price Group a Bargain on Earnings?
P/E is usually a straightforward way to compare an asset manager like T. Rowe Price Group with peers that already earn steady profits.
T. Rowe Price Group trades on a P/E of about 11.1x. That is below the Capital Markets industry average of 38.6x and also below the peer average of 26.4x. The fair P/E that blends in the company’s margins, growth profile, size and risk comes out at roughly 13.4x, which is still above where the stock trades today.
This gap suggests the current price reflects a discount to what the tailored fair ratio implies, even after the recent news on acquisitions and AI and crypto initiatives. For investors comparing options across the sector, T. Rowe Price Group appears inexpensive on this earnings multiple check.
On the P/E multiple, T. Rowe Price Group stock appears undervalued relative to both its fair ratio and industry benchmarks.

See what the numbers say about this price — find out in our valuation breakdown.
The T. Rowe Price Group Narrative: What Would Justify Today's Price?
Simply Wall St Narratives for T. Rowe Price Group pick up where this valuation gap leaves off and explain what combination of growth, margins and earnings trajectory would need to occur for the stock to be worth materially more or less than today’s price on a forward view. Rather than relying on a single multiple or model output, each narrative sets out the specific assumptions behind its fair value so you can compare them with T. Rowe Price Group's results as they are reported over time on the Community page.
The community is split on T. Rowe Price Group, with one camp focused on ETF and retirement growth and another worried about fee pressure and outflows.
Bull case: 9% undervalued
"The emphasis on personalized and innovative retirement products, including digital tools like the Social Security Optimizer, aims to drive inflows into their target date franchise..."
Read the full Bull Case to see why T. Rowe Price Group could be undervalued
Bear case: 24% overvalued
"T. Rowe Price Group is experiencing significant fee compression with a higher-than-average rate of 2% in 2024, due to a mix shift in sales towards lower-fee vehicles like ETFs and institutional accounts, impacting their net revenue outlook negatively..."
Read the full Bear Case to see why T. Rowe Price Group could be overvalued
Do you think there's more to the story for T. Rowe Price Group? Head over to our Community to see what others are saying!
The Bottom Line
T. Rowe Price Group screens as undervalued on both the Excess Returns intrinsic value estimate and the P/E multiple checks, so the market is pricing in a fair amount of caution already. The broader valuation work points to a company that may be priced below what its earnings power and equity base imply; yet the real test is whether new efforts in fixed income, AI and digital assets translate into durable cash flows. The crux for investors is whether that discount reflects a genuine opportunity or a market that is correctly bracing for execution risk around these newer growth areas.
This article by Simply Wall St is general in nature. We provide commentary based on historical data and analyst forecasts only using an unbiased methodology and our articles are not intended to be financial advice. It does not constitute a recommendation to buy or sell any stock, and does not take account of your objectives, or your financial situation. We aim to bring you long-term focused analysis driven by fundamental data. Note that our analysis may not factor in the latest price-sensitive company announcements or qualitative material. Simply Wall St has no position in any stocks mentioned.
Have feedback on this article? Concerned about the content? Get in touch with us directly. Alternatively, email editorial-team@simplywallst.com