


Bank of America recently updated its view on several software stocks, including Asana (ASAN), highlighting AI as a key theme across the group. For investors, this refocuses attention on Asana’s business fundamentals and valuation.
See our latest analysis for Asana.
Asana’s recent share price momentum has been strong, with a 30 day share price return of 42.27% and a 90 day share price return of 48.33%. However, the year to date share price return is still down 24.69% and the 1 year total shareholder return is down 31.02%, which points to improving short term sentiment after a weaker long term experience.
If you want to see how other software and AI focused stocks have been moving, this could be a good moment to scan 29 AI small caps
After a sharp short term rebound but weak longer term returns, Asana now forces a practical choice: lean into the recent strength or wait for a cheaper entry. The answer sits in what the current valuation actually implies.
Most Popular Narrative: 7% Overvalued
Asana closed at $9.76 compared with a narrative fair value of about $9.13, which suggests the current price already reflects a lot of the expected progress.
Asana's integration of AI into structured workflow automation (AI Studio, smart workflows, and upcoming AI Teammates) is unlocking new, highly valued enterprise use cases that increase platform stickiness, boost customer expansion and drive higher ARPU, supporting accelerated mid
to long-term revenue growth.
Curious what has to happen for that fair value to hold up. Revenue expectations, margin shifts and a future earnings multiple all work together in this narrative.
Result: Fair Value of $9.13 (OVERVALUED)
Have a read of the narrative in full and understand what's behind the forecasts.
However, Asana still faces pressure from strong competitors like Microsoft and Atlassian, along with regulatory and compliance costs that could weigh on margins and growth expectations.
Find out about the key risks to this Asana narrative.
Another View On Asana’s Valuation
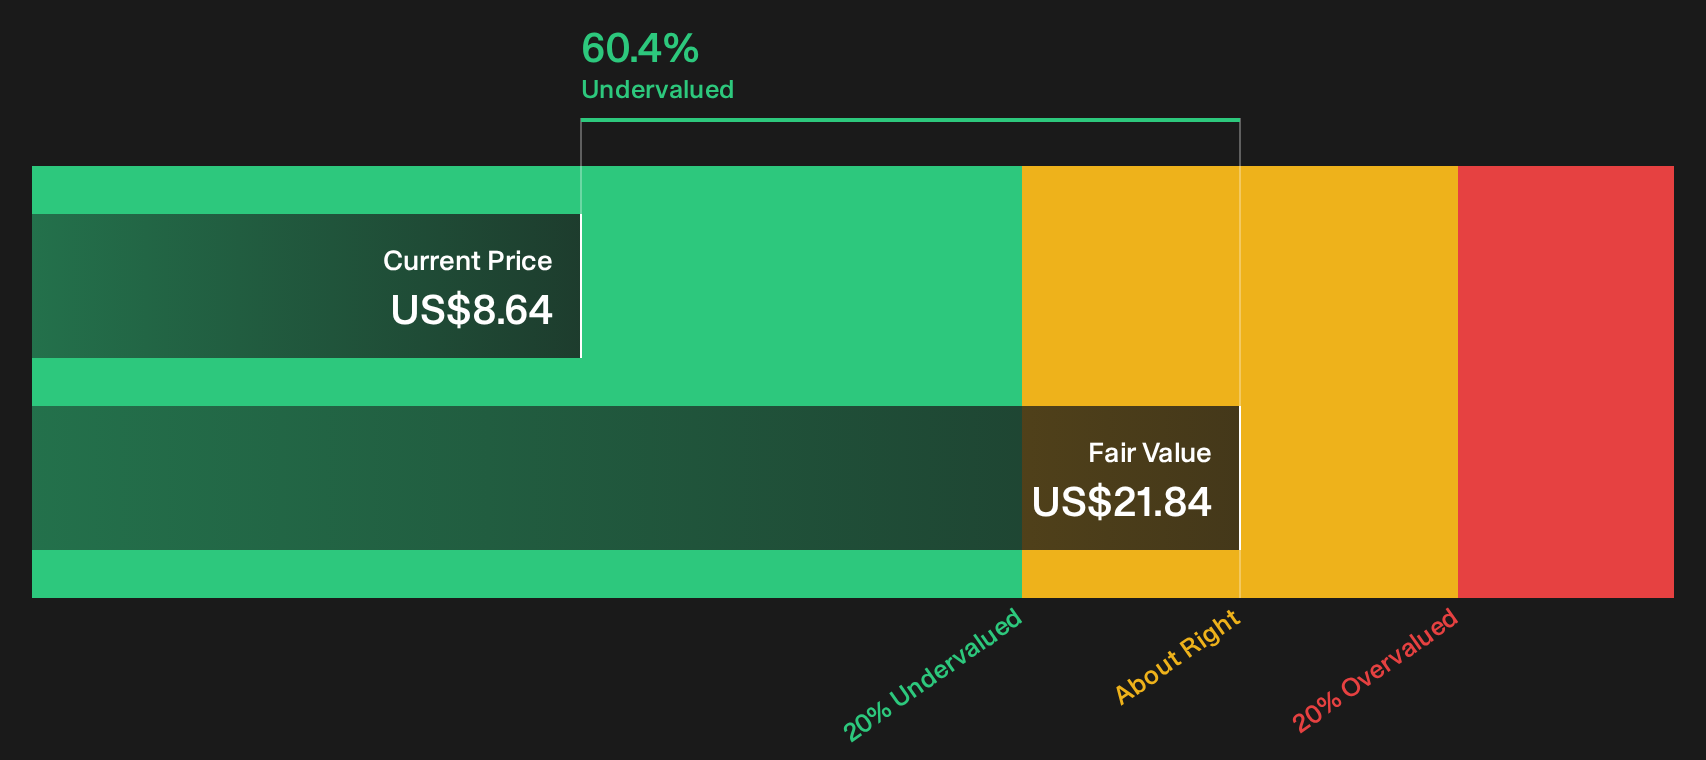
While the narrative fair value pegs Asana at $9.13 and flags the stock as slightly overvalued, the SWS DCF model points in a different direction. On that view, Asana at $9.76 is trading at a discount to an estimated future cash flow value of $15.91. Which story do you think is closer to reality?
For a closer look at how those future cash flows are modeled and discounted, including the assumptions that drive the gap to today’s price, Look into how the SWS DCF model arrives at its fair value.
Next Steps
With mixed signals across Asana’s price moves and valuation models, sentiment is clearly split. Act while the data is fresh and shape your own view by weighing the 3 key rewards and 3 important warning signs
Looking for more investment ideas beyond Asana?
If Asana has sharpened your interest in what is possible, do not stop here. Fresh opportunities often emerge first in focused stock lists.
- Target sturdier portfolios by reviewing companies in the solid balance sheet and fundamentals stocks screener (51 results) that pair financial resilience with clearer fundamentals.
- Hunt for mispriced opportunities by scanning the screener containing 18 high quality undiscovered gems before they attract wider attention.
- Strengthen your income stream by checking which companies qualify as 12 dividend fortresses right now.
This article by Simply Wall St is general in nature. We provide commentary based on historical data and analyst forecasts only using an unbiased methodology and our articles are not intended to be financial advice. It does not constitute a recommendation to buy or sell any stock, and does not take account of your objectives, or your financial situation. We aim to bring you long-term focused analysis driven by fundamental data. Note that our analysis may not factor in the latest price-sensitive company announcements or qualitative material. Simply Wall St has no position in any stocks mentioned.
Have feedback on this article? Concerned about the content? Get in touch with us directly. Alternatively, email editorial-team@simplywallst.com