


The Canadian stock market has recently experienced fluctuations, with rising long-term bond yields putting pressure on investor sentiment and causing stocks to dip. In this environment, identifying undervalued stocks can be particularly appealing as they may offer potential value despite broader market volatility.
Top 10 Undervalued Stocks Based On Cash Flows In Canada
| Name | Current Price | Fair Value (Est) | Discount (Est) |
| Topicus.com (TSXV:TOI) | CA$103.13 | CA$175.55 | 41.3% |
| Tantalus Systems Holding (TSX:GRID) | CA$3.99 | CA$7.17 | 44.4% |
| SECURE Waste Infrastructure (TSX:SES) | CA$24.05 | CA$47.93 | 49.8% |
| Pan American Silver (TSX:PAAS) | CA$73.07 | CA$140.28 | 47.9% |
| NFI Group (TSX:NFI) | CA$22.27 | CA$43.08 | 48.3% |
| Groupe Dynamite (TSX:GRGD) | CA$65.38 | CA$115.29 | 43.3% |
| Gildan Activewear (TSX:GIL) | CA$74.35 | CA$147.45 | 49.6% |
| Constellation Software (TSX:CSU) | CA$3070.03 | CA$5929.48 | 48.2% |
| Celestica (TSX:CLS) | CA$426.16 | CA$699.40 | 39.1% |
| Aritzia (TSX:ATZ) | CA$135.51 | CA$245.84 | 44.9% |
Let's explore several standout options from the results in the screener.
Finning International (TSX:FTT)
Overview: Finning International Inc. operates by selling, servicing, and renting heavy equipment, engines, and related products across Canada, Chile, the United Kingdom, Argentina, and other international markets with a market cap of CA$11.71 billion.
Operations: The company generates CA$11.16 billion in revenue from its operations involving the sale, service, and rental of heavy equipment, engines, and related products across its markets.
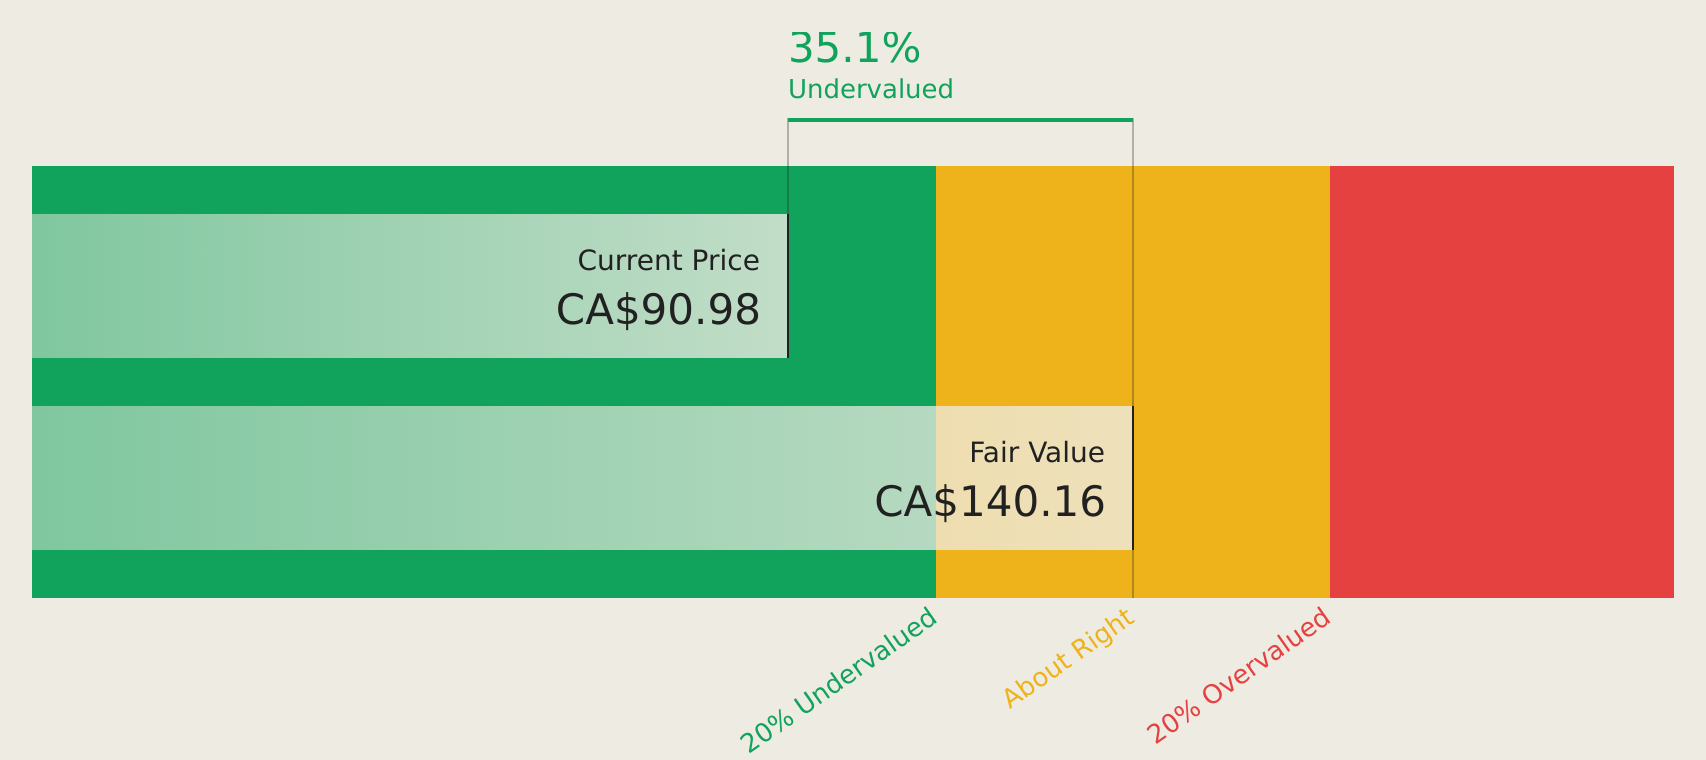
Estimated Discount To Fair Value: 18.3%
Finning International is trading at CA$92.12, below its estimated future cash flow value of CA$112.74, suggesting potential undervaluation based on cash flows. Despite a slower revenue growth forecast of 4.8% per year, it surpasses the Canadian market average and has a high forecasted return on equity of 24.8%. Recent debt financing aims to refinance existing obligations, while earnings have shown moderate growth, indicating financial stability amidst strategic capital management efforts.
- Insights from our recent growth report point to a promising forecast for Finning International's business outlook.
- Delve into the full analysis health report here for a deeper understanding of Finning International.
Magellan Aerospace (TSX:MAL)
Overview: Magellan Aerospace Corporation engineers and manufactures aeroengine and aerostructure components for aerospace markets in Canada, the United States, and Europe, with a market cap of CA$1.84 billion.
Operations: The company's revenue is primarily derived from its aerospace segment, which generated CA$1.12 billion.
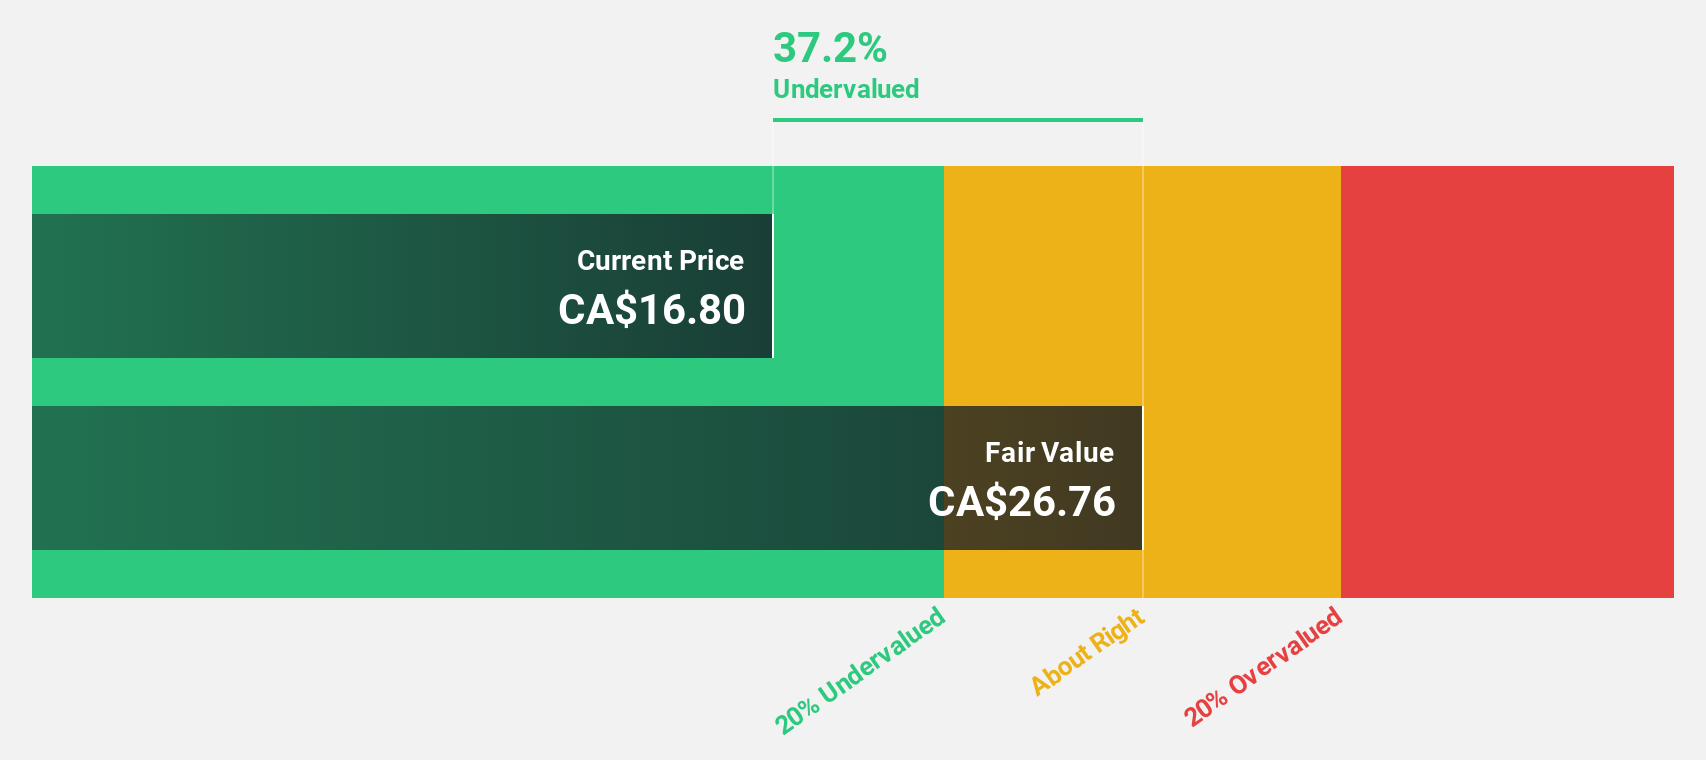
Estimated Discount To Fair Value: 10.8%
Magellan Aerospace is trading below its estimated future cash flow value of CA$37.67, indicating potential undervaluation. Recent earnings showed a significant increase, with second-quarter net income rising to CA$19.83 million from CA$5.37 million a year ago. Revenue growth is forecast at 6.8% annually, surpassing the Canadian market average of 4%. The company recently secured a contract for M-72 Light Anti-Tank Weapon production, enhancing its defence sector presence and long-term revenue prospects.
- The analysis detailed in our Magellan Aerospace growth report hints at robust future financial performance.
- Unlock comprehensive insights into our analysis of Magellan Aerospace stock in this financial health report.
Stantec (TSX:STN)
Overview: Stantec Inc. offers professional services for infrastructure and facilities to both private and public sectors across Canada, the United States, and internationally, with a market cap of CA$11.42 billion.
Operations: The company's revenue segments are comprised of CA$1.56 billion from Canada, CA$1.70 billion from global operations, and CA$3.56 billion from the United States.
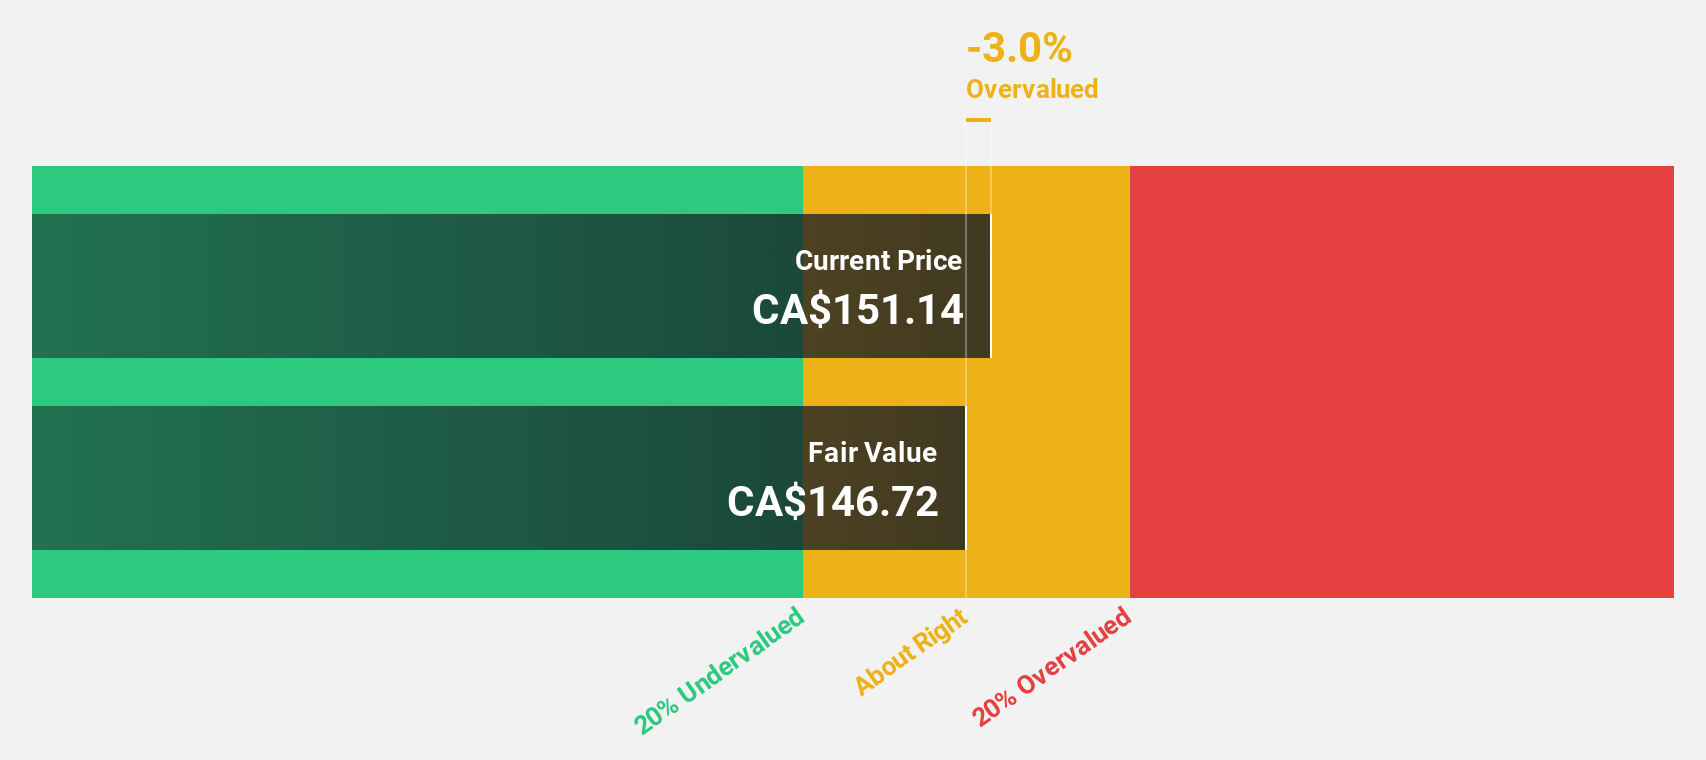
Estimated Discount To Fair Value: 32%
Stantec is trading at CA$104.69, below its estimated future cash flow value of CA$153.97, suggesting potential undervaluation. The company reported solid earnings growth with Q2 net income rising to CA$150.3 million from CA$135.4 million a year ago and reaffirmed strong revenue growth guidance for 2026. Stantec's recent contract wins, including a USD 150 million project with the USACE, bolster its position in infrastructure design and coastal resilience sectors, supporting future cash flows despite high debt levels.
- In light of our recent growth report, it seems possible that Stantec's financial performance will exceed current levels.
- Click here and access our complete balance sheet health report to understand the dynamics of Stantec.
Summing It All Up
- Unlock more gems! Our Undervalued TSX Stocks Based On Cash Flows screener has unearthed 27 more companies for you to explore.Click here to unveil our expertly curated list of 30 Undervalued TSX Stocks Based On Cash Flows.
- Hold shares in these firms? Setup your portfolio in Simply Wall St to seamlessly track your investments and receive personalized updates on your portfolio's performance.
- Take control of your financial future using Simply Wall St, offering free, in-depth knowledge of international markets to every investor.
Looking For Alternative Opportunities?
- Explore high-performing small cap companies that haven't yet garnered significant analyst attention.
- Diversify your portfolio with solid dividend payers offering reliable income streams to weather potential market turbulence.
- Fuel your portfolio with companies showing strong growth potential, backed by optimistic outlooks both from analysts and management.
This article by Simply Wall St is general in nature. We provide commentary based on historical data and analyst forecasts only using an unbiased methodology and our articles are not intended to be financial advice. It does not constitute a recommendation to buy or sell any stock, and does not take account of your objectives, or your financial situation. We aim to bring you long-term focused analysis driven by fundamental data. Note that our analysis may not factor in the latest price-sensitive company announcements or qualitative material. Simply Wall St has no position in any stocks mentioned.
Have feedback on this article? Concerned about the content? Get in touch with us directly. Alternatively, email editorial-team@simplywallst.com