


Lucid Group (LCID) shares fell about 7.7% after broader pressure on growth stocks, even as investors assessed the company’s latest European retail move and its ongoing focus on cost savings and production plans.
For context, Lucid Group’s share price has fallen 55.61% year to date and the 1 year total shareholder return is down 76.20%. The latest 1 month share price decline of 23.85% and recent tariff related headlines suggest momentum has been fading despite ongoing product launches and European retail partnerships.
Spot opportunities beyond Lucid Group's recent pressure by scanning a curated group of 20 high quality undiscovered gems that may be flying under the radar.Lucid Group now trades at US$4.95, while the average analyst price target sits at US$8.11, a wide gap after this latest slide. How far does fair value really differ from today’s pressured share price?
Most Popular Narrative: 41.1% Undervalued
Lucid Group’s most followed narrative pegs fair value at $8.40 per share compared with the latest close at $4.95. That gap rests on some ambitious building blocks around growth, margins and capital intensity.
The newly announced Uber and Nuro partnership, including a planned $300 million Uber investment and a commitment to deploy at least 20,000 Lucid Gravity vehicles as robotaxis over six years, is expected to open a large and fast-growing autonomous fleet market to Lucid, driving significant revenue expansion and potential margin improvement via technology licensing and high-volume fleet sales.
Read the complete narrative. Read the complete narrative.
Want to understand why a loss making Lucid Group is tied to that kind of valuation gap? The narrative leans heavily on aggressive revenue scaling, better long term margins and a richer future earnings multiple than many established automakers. Curious which combination of growth forecasts and profitability assumptions need to line up for $8.40 to make sense.
Result: Fair Value of $8.40 (UNDERVALUED)
Have a read of the narrative in full and understand what's behind the forecasts.
However, Lucid Group still faces heavy losses and negative gross margins, while ongoing capital raises and potential dilution could quickly challenge the current undervalued narrative.
Find out about the key risks to this Lucid Group narrative.
Another View: Lucid Group Looks Expensive On Sales
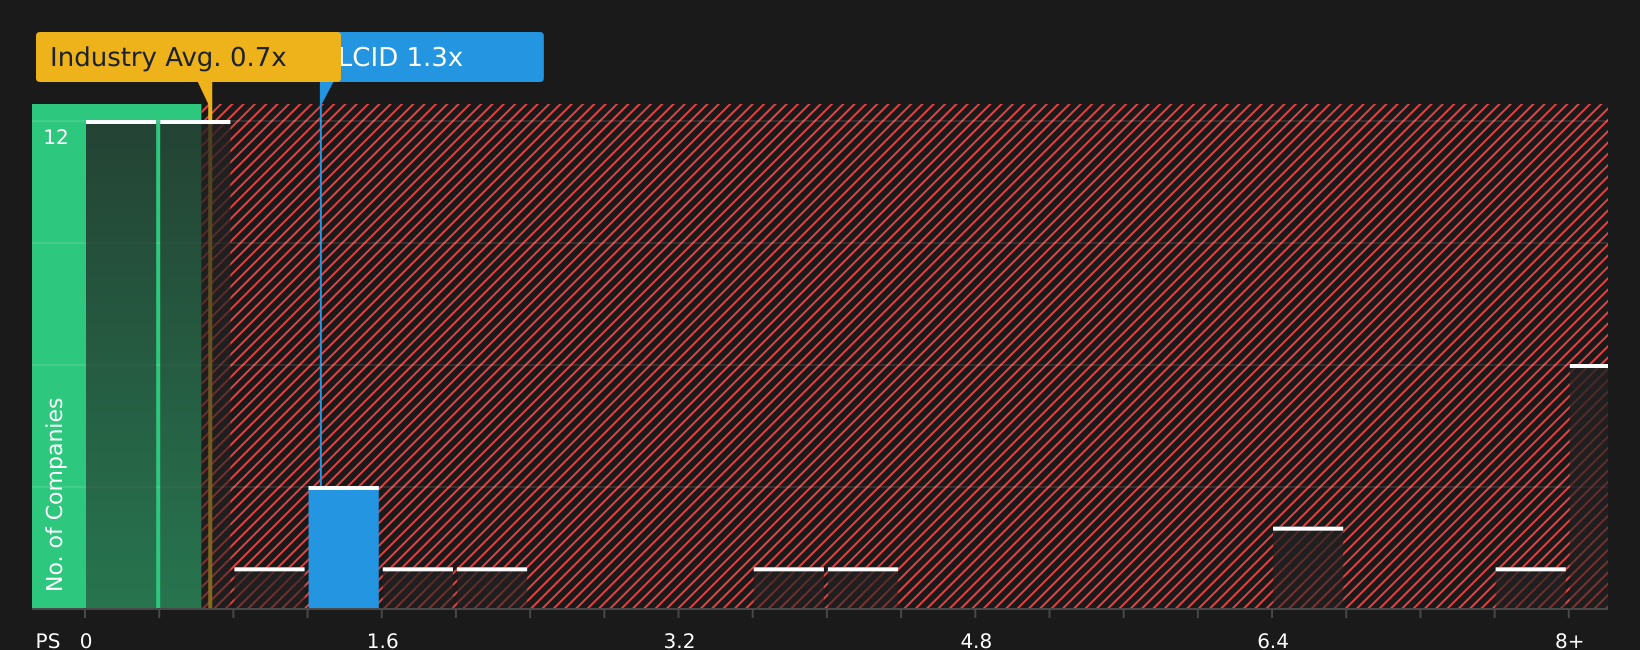
While the most followed Lucid Group narrative leans on future earnings and higher multiples, today’s P/S ratio tells a tougher story. Lucid trades on 1.3x sales compared with about 0.7x for the US Auto industry and roughly 1.1x across peers, while the fair ratio is 0x.
That gap points to meaningful valuation risk if the market shifts closer to the fair ratio or industry levels instead of rewarding Lucid with a premium. For investors weighing position size and time horizon, the question is how much execution proof is needed before this premium feels comfortable enough to accept.
See what the numbers say about this price — find out in our valuation breakdown.
Next Steps
After all of this around Lucid Group, the key question is whether the crowd is too cautious or still too optimistic. Act quickly by reviewing both sides of the story for yourself and weigh the 1 key reward and 4 important warning signs.
Looking for more investment ideas beyond Lucid Group?
If Lucid Group has your attention, do not stop there. Use the Simply Wall Street Screener to quickly surface fresh opportunities that match your style.
- Spot potential value opportunities early by reviewing a focused set of 51 high quality undervalued stocks that combine quality fundamentals with compressed market expectations.
- Prioritise resilience by scanning a hand picked group of 75 resilient stocks with low risk scores that aim to keep volatility and financial red flags in check.
- Strengthen your core holdings by checking a curated list of solid balance sheet and fundamentals (51 results) to find companies with sturdier finances supporting their long term plans.
This article by Simply Wall St is general in nature. We provide commentary based on historical data and analyst forecasts only using an unbiased methodology and our articles are not intended to be financial advice. It does not constitute a recommendation to buy or sell any stock, and does not take account of your objectives, or your financial situation. We aim to bring you long-term focused analysis driven by fundamental data. Note that our analysis may not factor in the latest price-sensitive company announcements or qualitative material. Simply Wall St has no position in any stocks mentioned.
Have feedback on this article? Concerned about the content? Get in touch with us directly. Alternatively, email editorial-team@simplywallst.com