


As European markets navigate through global bond sell-offs and inflationary pressures, investors are increasingly turning their attention to dividend stocks as a potential source of steady income amidst the volatility. With the pan-European STOXX Europe 600 Index experiencing slight declines, identifying robust dividend-paying companies can be an effective strategy for those looking to add stability and income potential to their portfolios.
Top 10 Dividend Stocks In Europe
| Name | Dividend Yield | Dividend Rating |
| Zinzino (OM:ZZ B) | 4.33% | ★★★★★★ |
| UNIQA Insurance Group (WBAG:UQA) | 4.09% | ★★★★★☆ |
| Telekom Austria (WBAG:TKA) | 4.16% | ★★★★★★ |
| Swiss Re (SWX:SREN) | 4.60% | ★★★★★☆ |
| Rubis (ENXTPA:RUI) | 6.22% | ★★★★★★ |
| Naturgy Energy Group (BME:NTGY) | 5.98% | ★★★★★☆ |
| Hannover Rück (XTRA:HNR1) | 4.88% | ★★★★★★ |
| EFG International (SWX:EFGN) | 4.01% | ★★★★★☆ |
| Edel SE KGaA (XTRA:EDL) | 6.41% | ★★★★★★ |
| Cembra Money Bank (SWX:CMBN) | 5.15% | ★★★★★★ |
Click here to see the full list of 191 stocks from our Top European Dividend Stocks screener.
Below we spotlight a couple of our favorites from our exclusive screener.
UNIQA Insurance Group (WBAG:UQA)
Simply Wall St Dividend Rating: ★★★★★☆
Overview: UNIQA Insurance Group AG is an insurance company that provides services in Austria and Central and Eastern Europe, with a market cap of €5.41 billion.
Operations: UNIQA Insurance Group AG's revenue is primarily generated from its Property and Casualty Insurance segments, with €1.51 billion from Reinsurance, €2.61 billion from UNIQA Austria, and €2.49 billion from UNIQA International; Life Insurance contributes through UNIQA Austria (€307.73 million) and International Segments (€806.92 million); while Health Insurance revenue comes from UNIQA Austria (€1.41 billion) and International Segments (€145.36 million).
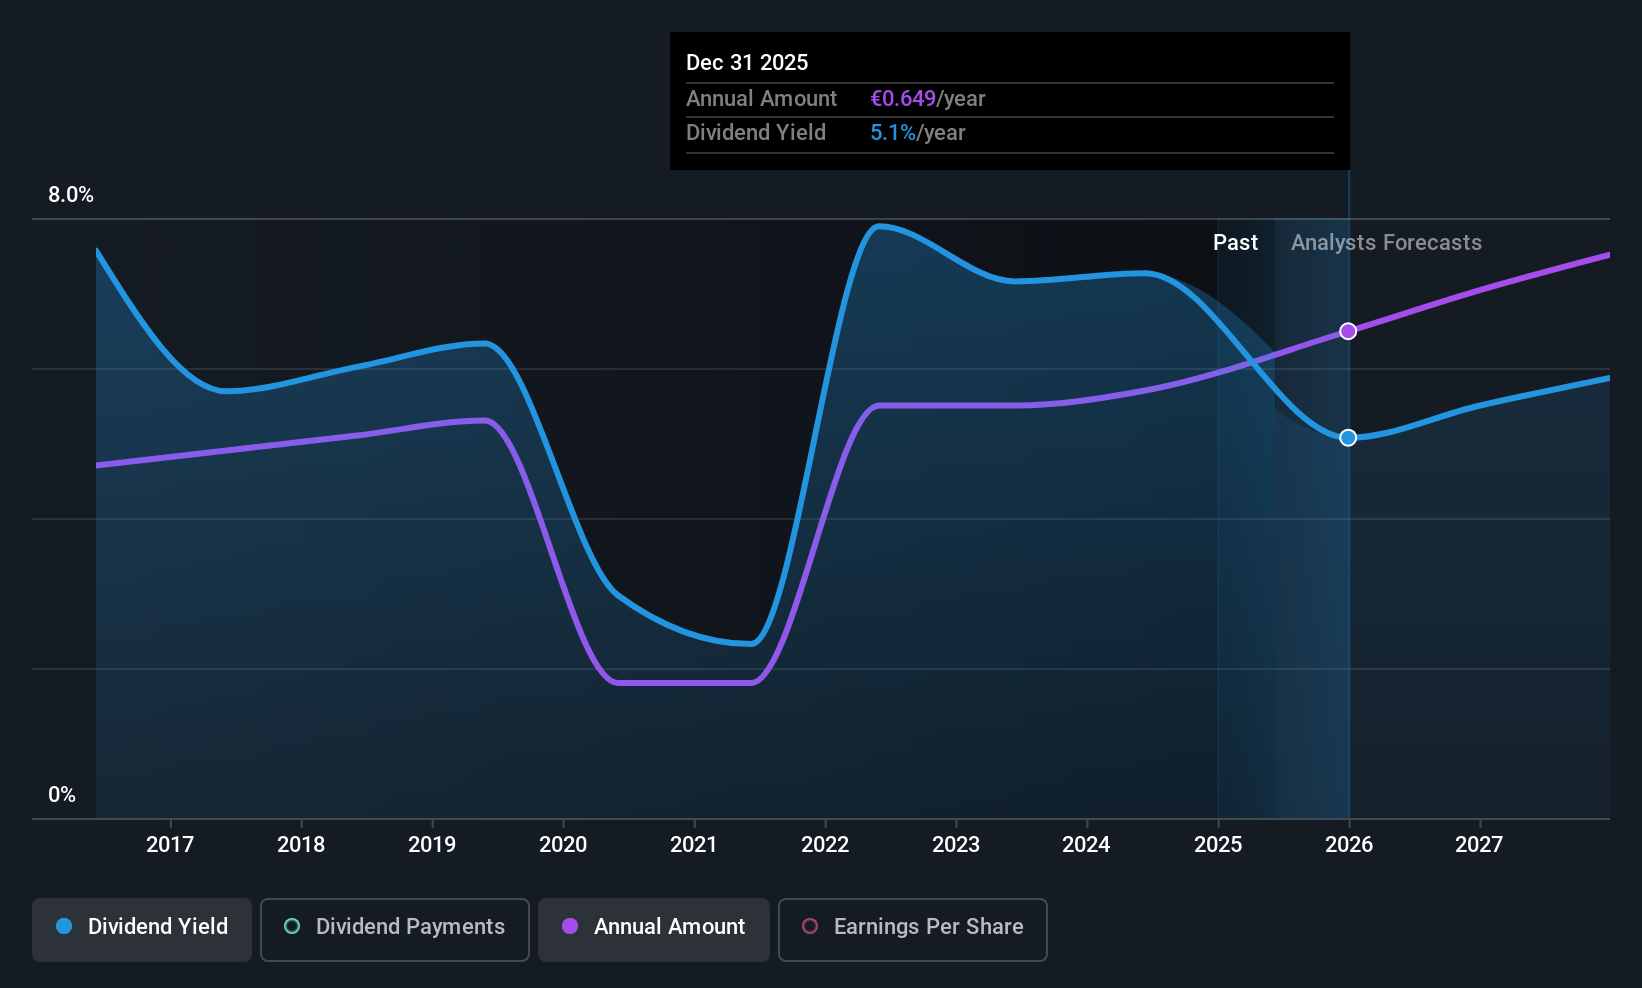
Dividend Yield: 4.1%
UNIQA Insurance Group's dividend is supported by a low cash payout ratio of 19.9% and a reasonable earnings payout ratio of 49%, indicating sustainability, despite historical volatility. Recent earnings growth, with net income rising to €258.4 million for H1 2026, supports its position as a top-tier dividend payer in Austria at 4.09%. However, past instability in dividends suggests caution for those seeking consistent income streams from their investments.
- Delve into the full analysis dividend report here for a deeper understanding of UNIQA Insurance Group.
- The analysis detailed in our UNIQA Insurance Group valuation report hints at an deflated share price compared to its estimated value.
Tire Company Debica (WSE:DBC)
Simply Wall St Dividend Rating: ★★★★☆☆
Overview: Tire Company Debica S.A. manufactures and sells tires for passenger cars, vans, and trucks in Poland with a market cap of PLN1.42 billion.
Operations: Tire Company Debica S.A. generates its revenue primarily from the sale of rubber tires, amounting to PLN2.85 billion.
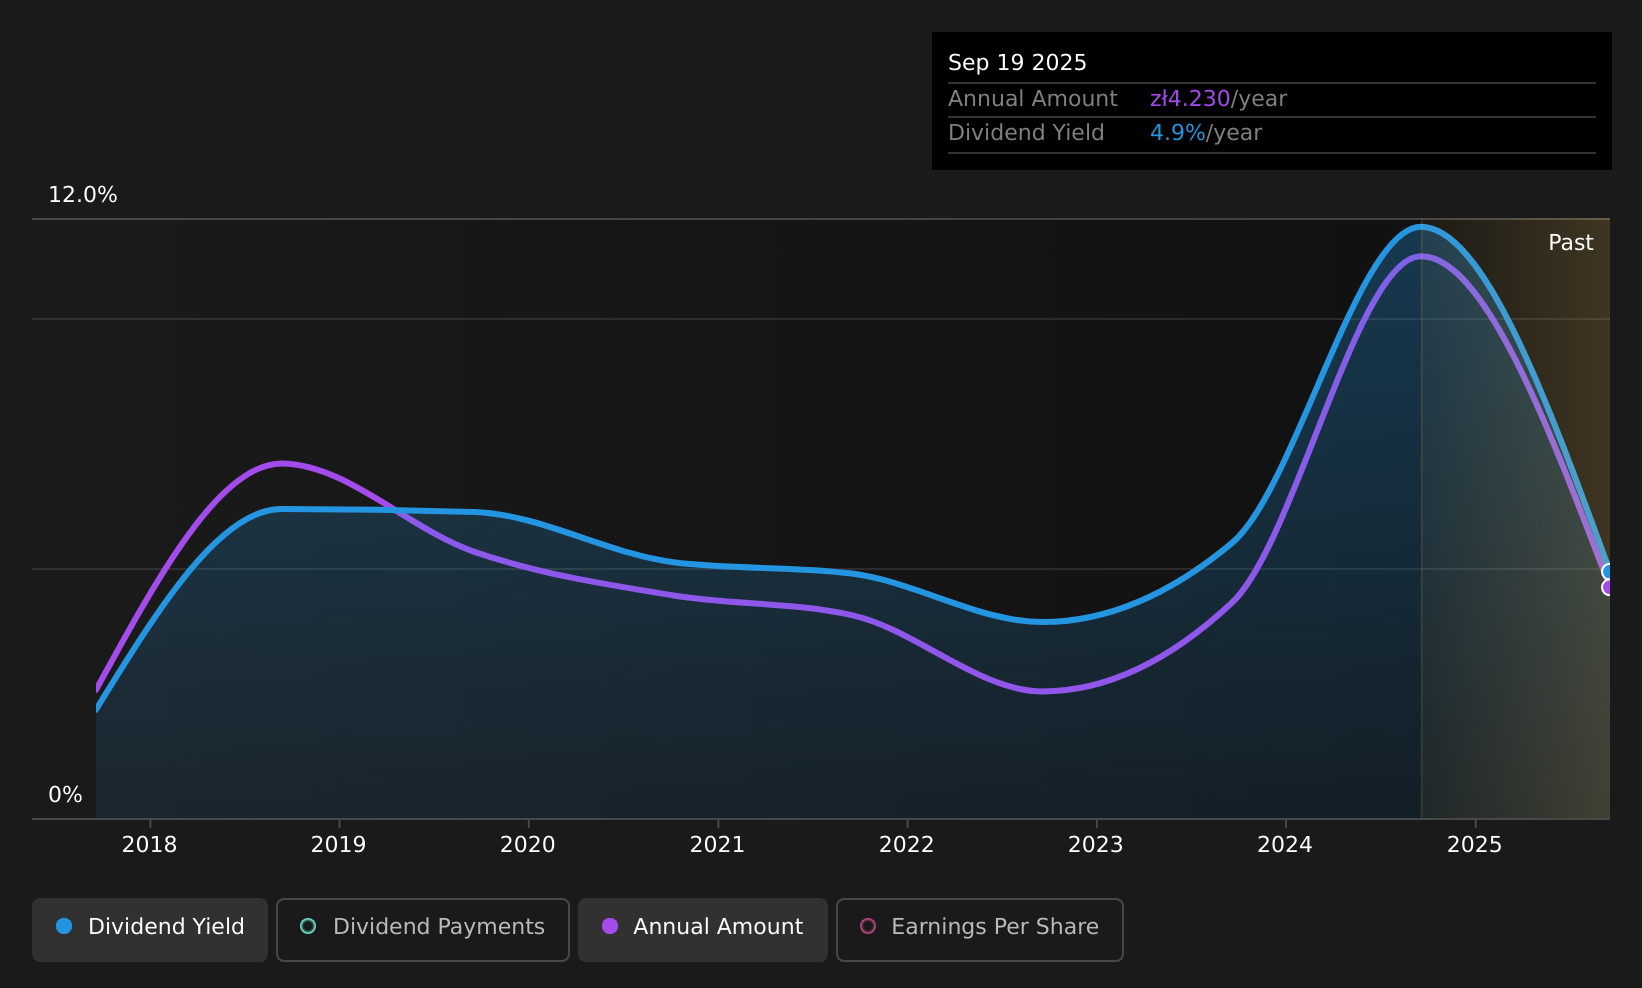
Dividend Yield: 4.1%
Tire Company Debica's dividends are covered by a low cash payout ratio of 32.4% and an earnings payout ratio of 43.9%, suggesting sustainability despite historical volatility over the past decade. The dividend yield is 4.11%, below the top tier in Poland, while its price-to-earnings ratio of 12.3x indicates good value compared to the market average of 13x. Profit margins have decreased to 4% from last year's 6.9%.
- Navigate through the intricacies of Tire Company Debica with our comprehensive dividend report here.
- In light of our recent valuation report, it seems possible that Tire Company Debica is trading beyond its estimated value.
Bijou Brigitte modische Accessoires (XTRA:BIJ)
Simply Wall St Dividend Rating: ★★★★☆☆
Overview: Bijou Brigitte modische Accessoires AG is involved in the manufacturing, importing, and selling of fashion jewelry, gold and silver jewelry, fashion accessories, and complementary articles with a market cap of €359.67 million.
Operations: The company's revenue is primarily generated from its Jewelry & Watches segment, which accounts for €338.18 million.
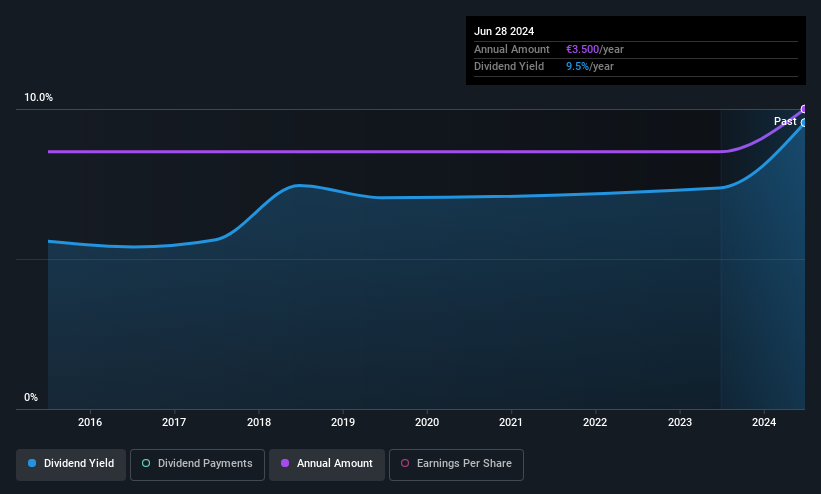
Dividend Yield: 7.3%
Bijou Brigitte modische Accessoires offers a dividend yield of 7.32%, placing it among the top 25% in Germany. However, its dividends have been volatile over the past decade and are not well covered by earnings, with a high payout ratio of 111.4%. Despite this, dividends are supported by cash flows due to a low cash payout ratio of 36%. The stock trades at an attractive valuation, significantly below estimated fair value.
- Click to explore a detailed breakdown of our findings in Bijou Brigitte modische Accessoires' dividend report.
- Our valuation report here indicates Bijou Brigitte modische Accessoires may be undervalued.
Make It Happen
- Discover the full array of 191 Top European Dividend Stocks right here.
- Invested in any of these stocks? Simplify your portfolio management with Simply Wall St and stay ahead with our alerts for any critical updates on your stocks.
- Invest smarter with the free Simply Wall St app providing detailed insights into every stock market around the globe.
Contemplating Other Strategies?
- Explore high-performing small cap companies that haven't yet garnered significant analyst attention.
- Fuel your portfolio with companies showing strong growth potential, backed by optimistic outlooks both from analysts and management.
- Find companies with promising cash flow potential yet trading below their fair value.
This article by Simply Wall St is general in nature. We provide commentary based on historical data and analyst forecasts only using an unbiased methodology and our articles are not intended to be financial advice. It does not constitute a recommendation to buy or sell any stock, and does not take account of your objectives, or your financial situation. We aim to bring you long-term focused analysis driven by fundamental data. Note that our analysis may not factor in the latest price-sensitive company announcements or qualitative material. Simply Wall St has no position in any stocks mentioned.
Have feedback on this article? Concerned about the content? Get in touch with us directly. Alternatively, email editorial-team@simplywallst.com