


In August 2026, Asian markets have been navigating a complex landscape marked by fluctuating investor sentiment and mixed economic signals, with technology shares experiencing significant volatility amid global AI investment trends. As investors seek opportunities in this uncertain environment, identifying stocks that are potentially undervalued relative to their intrinsic worth can be an effective strategy for those looking to capitalize on market inefficiencies.
Top 10 Undervalued Stocks Based On Cash Flows In Asia
| Name | Current Price | Fair Value (Est) | Discount (Est) |
| Sansha Electric ManufacturingLtd (TSE:6882) | ¥1175.00 | ¥2309.90 | 49.1% |
| Quality Reliability Technology (KOSDAQ:A405100) | ₩12580.00 | ₩24768.35 | 49.2% |
| Moshi Moshi Retail Corporation (SET:MOSHI) | THB38.25 | THB75.49 | 49.3% |
| Mao Geping Cosmetics (SEHK:1318) | HK$49.90 | HK$98.25 | 49.2% |
| gremsInc (TSE:3150) | ¥2488.00 | ¥4918.28 | 49.4% |
| Grand Process Technology (TPEX:3131) | NT$2485.00 | NT$4864.91 | 48.9% |
| GO (TSE:581A) | ¥4445.00 | ¥8775.46 | 49.3% |
| Delton Technology (Guangzhou) (SZSE:001389) | CN¥155.90 | CN¥306.39 | 49.1% |
| Beijing HyperStrong Technology (SHSE:688411) | CN¥190.05 | CN¥373.80 | 49.2% |
| BEAUTY GARAGE (TSE:3180) | ¥1560.00 | ¥3112.28 | 49.9% |
We'll examine a selection from our screener results.
Mobvista (SEHK:1860)
Overview: Mobvista Inc. operates in the advertising and marketing technology sector, focusing on services that support the mobile internet ecosystem globally, with a market cap of HK$17.79 billion.
Operations: The company's revenue is primarily derived from its Advertising Technology Services, which generated $2.25 billion, and its Marketing Technology Business, contributing $18.14 million.
Estimated Discount To Fair Value: 25.5%
Mobvista is trading significantly below its estimated future cash flow value, suggesting it may be undervalued. The company's earnings are forecast to grow substantially faster than the Hong Kong market, with a projected annual growth rate of 46.3%. Recent earnings reports show strong performance, with half-year sales reaching US$1.16 billion and net income rising to US$46.73 million. Additionally, Mobvista's share buyback program could enhance net asset value per share and earnings per share.
- Our growth report here indicates Mobvista may be poised for an improving outlook.
- Dive into the specifics of Mobvista here with our thorough financial health report.

Baycurrent (TSE:6532)
Overview: Baycurrent, Inc., along with its subsidiaries, offers consulting services in Japan and has a market cap of ¥1.20 trillion.
Operations: The company generates revenue primarily through its Consulting Business segment, which accounted for ¥158.60 billion.
Estimated Discount To Fair Value: 43.6%
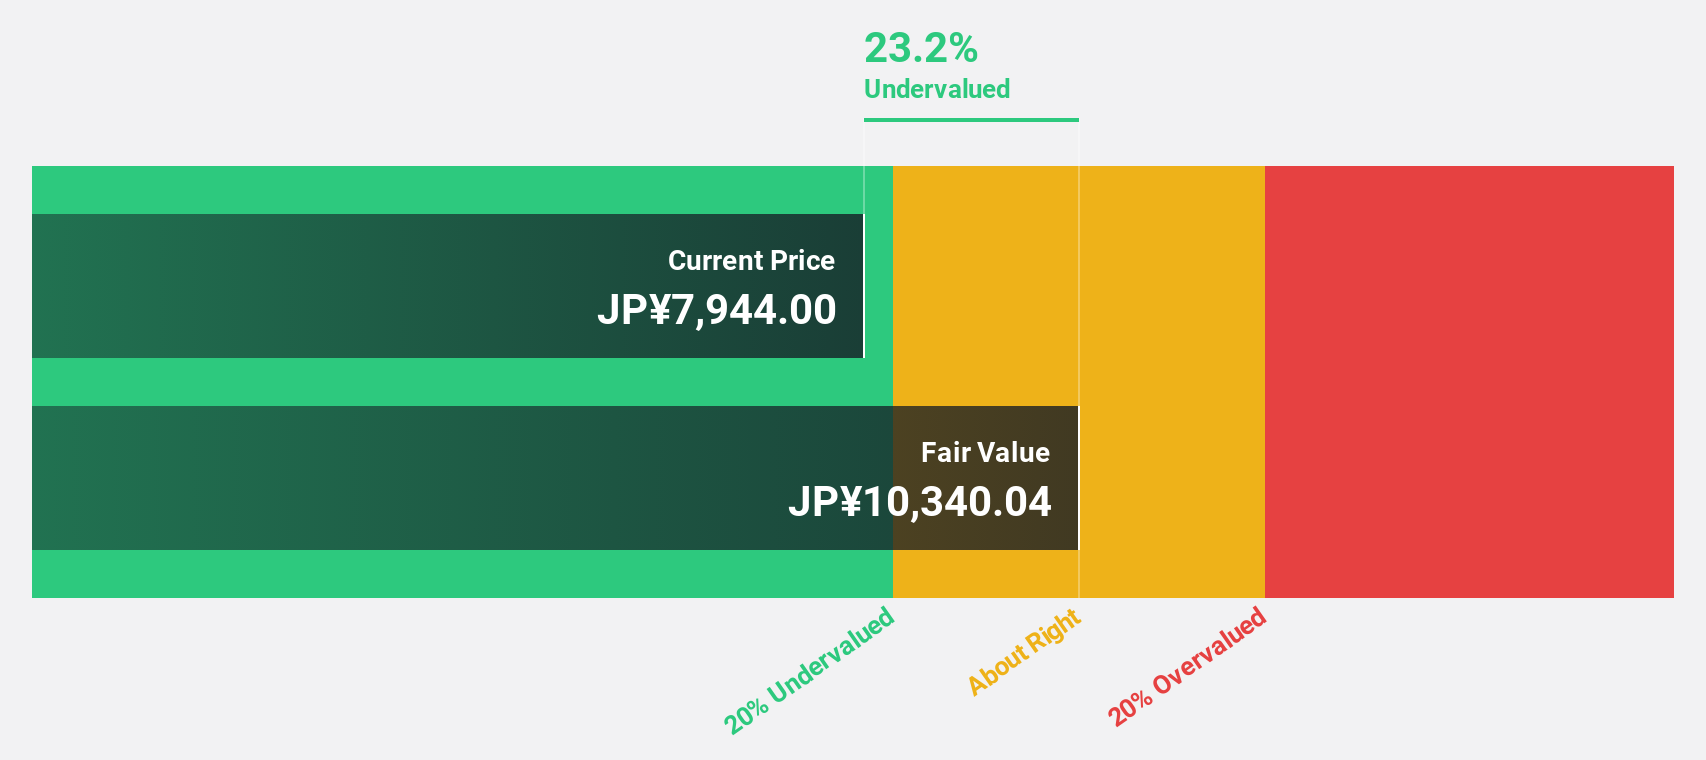
Baycurrent trades significantly below its estimated future cash flow value, highlighting potential undervaluation. Its earnings and revenue are projected to grow substantially faster than the Japanese market, with annual growth rates of 21.8% and 21.7%, respectively. Recent earnings for Q1 showed sales of ¥44.58 billion and net income of ¥10.73 billion, up from the previous year. The company completed a share buyback program, repurchasing shares worth ¥29.99 billion, potentially enhancing shareholder value.
- The growth report we've compiled suggests that Baycurrent's future prospects could be on the up.
- Navigate through the intricacies of Baycurrent with our comprehensive financial health report here.
Chenbro Micom (TWSE:8210)
Overview: Chenbro Micom Co., Ltd. is involved in the R&D, design, manufacture, processing, and sale of computer peripherals and main systems across various global markets including the United States, China, Taiwan, Singapore, and Europe with a market cap of NT$124.07 billion.
Operations: The company's revenue primarily comes from its computer peripherals segment, generating NT$27.33 billion.
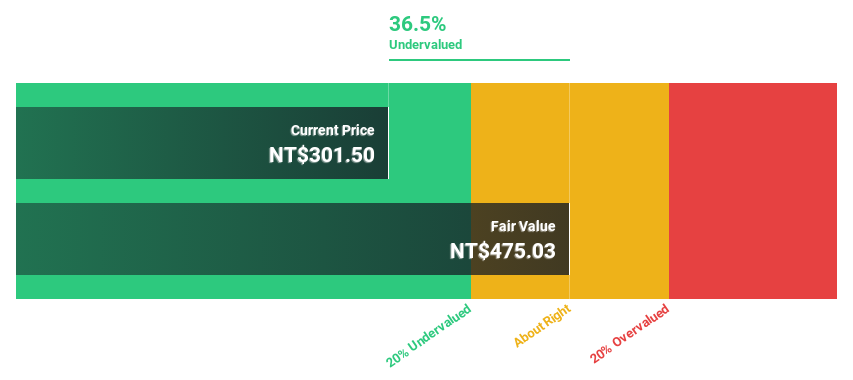
Estimated Discount To Fair Value: 13%
Chenbro Micom is trading 13% below its estimated fair value, with a forecasted revenue growth of 29.7% per year, outpacing the Taiwan market. Its earnings are expected to grow significantly at 28.3% annually over the next three years. Recent Q2 results showed strong performance with sales reaching NT$7.82 billion and net income climbing to NT$1.38 billion from NT$828.94 million a year ago, reflecting robust financial health despite share price volatility.
- In light of our recent growth report, it seems possible that Chenbro Micom's financial performance will exceed current levels.
- Unlock comprehensive insights into our analysis of Chenbro Micom stock in this financial health report.
Next Steps
- Embark on your investment journey to our 214 Undervalued Asian Stocks Based On Cash Flows selection here.
- Are you invested in these stocks already? Keep abreast of every twist and turn by setting up a portfolio with Simply Wall St, where we make it simple for investors like you to stay informed and proactive.
- Maximize your investment potential with Simply Wall St, the comprehensive app that offers global market insights for free.
Looking For Alternative Opportunities?
- Explore high-performing small cap companies that haven't yet garnered significant analyst attention.
- Diversify your portfolio with solid dividend payers offering reliable income streams to weather potential market turbulence.
- Fuel your portfolio with companies showing strong growth potential, backed by optimistic outlooks both from analysts and management.
This article by Simply Wall St is general in nature. We provide commentary based on historical data and analyst forecasts only using an unbiased methodology and our articles are not intended to be financial advice. It does not constitute a recommendation to buy or sell any stock, and does not take account of your objectives, or your financial situation. We aim to bring you long-term focused analysis driven by fundamental data. Note that our analysis may not factor in the latest price-sensitive company announcements or qualitative material. Simply Wall St has no position in any stocks mentioned.
Have feedback on this article? Concerned about the content? Get in touch with us directly. Alternatively, email editorial-team@simplywallst.com