


The Zhitong Finance App learned that the S&P 500 index broke out of the haze of summer sales a month ago, returned to a record track, and hit record highs several times in August. However, the Nasdaq 100 index is still about 4% below its all-time high on June 2, making it the only “left behind” among major US stock indexes that failed to recover lost ground. The rift between the two major benchmark stock indexes has continued for a full ten months. Behind this split is a quiet change in market leadership, as well as a profound reshaping of capital logic.
The vein of differentiation: ten months of “disconnection”
The starting point of this round of differentiation can be traced back to October 29 of last year. The Nasdaq 100 index peaked and fell back on the same day, then fell into a correction range. Meanwhile, the S&P 500 returned to an all-time high in mid-December last year, while the Nasdaq 100 index fell out of touch with a new high at the end of January of the following year. The subsequent spring sell-off wave once caused the two to fall at the same time, bottom at the same time, and even complete a simultaneous rebound just a day apart. The divergence seems to have been smoothed out.
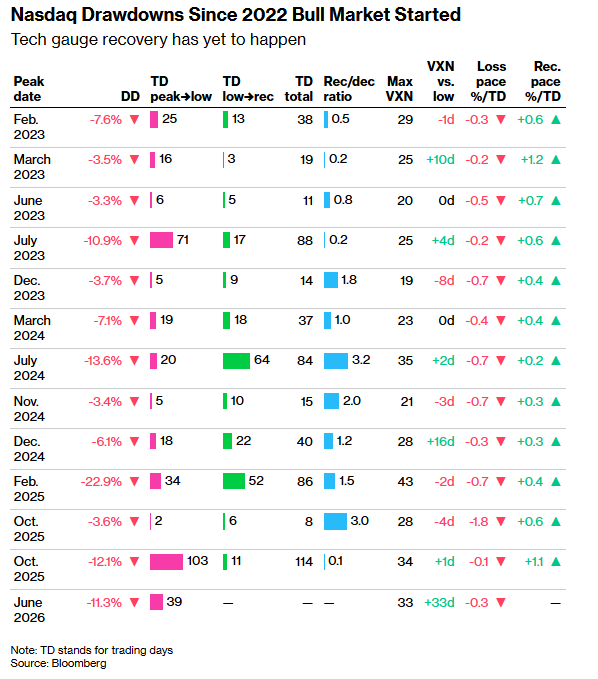
Since the beginning of the 2022 bull market, the NASDAQ has pulled back more than 100 times
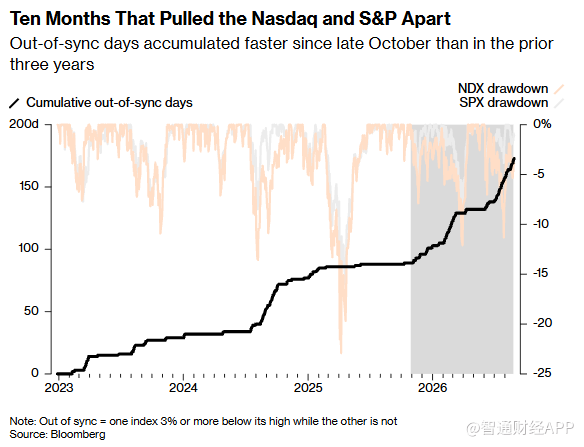
However, the collapse of the chip sector in June became a key turning point where the two major indices were clearly disconnected. The performance of the S&P 500 index was relatively stable, but the Nasdaq 100 index fell sharply. Market discussions about “differentiation” may have started at that time, but this situation has actually continued for ten months. Since the start of the current bull market in December 2022, the two major indices have seen a total of 173 “one benchmark index is pulling back, the other is not” diverging trends. Nearly half (84) of these have occurred in the past ten months.
The trend of the two major indices was “disconnected” for ten months
This summer pullback was the most extreme case of differentiation in the sample — the NASDAQ 100 bottomed out 33 trading days later than the S&P 500, and the retracement was more than double that of the latter. In contrast, in the previous seven pullbacks that simultaneously affected the two major benchmarks, the time difference between the two bottomed out was usually only a few trading days.
Historical law: the “lagging” recovery model of the NASDAQ 100
Looking back at 40 years of data, this differentiation is not random; it is traceable. Since 1985, in a deep correction where the two major indices have fallen by 10% or more simultaneously, the Nasdaq 100 has taken the lead in rebound 14 out of 16. The only exceptions are the bursting of the internet bubble and a slight lag in 2016.
However, in a scenario where the S&P 500 declined slightly and the technology sector was hit hard, the rules were completely reversed. Under such circumstances, the recovery of the Nasdaq 100 often lags behind the S&P 500 index, with the most significant lag being concentrated in 1992, 2005, 2012, and 2024 — all of these years were “digestion periods” after the boom, rather than moments of crisis.
Technology stocks: they were the first to rebound during the deep crisis, but recovery lagged behind due to minor adjustments
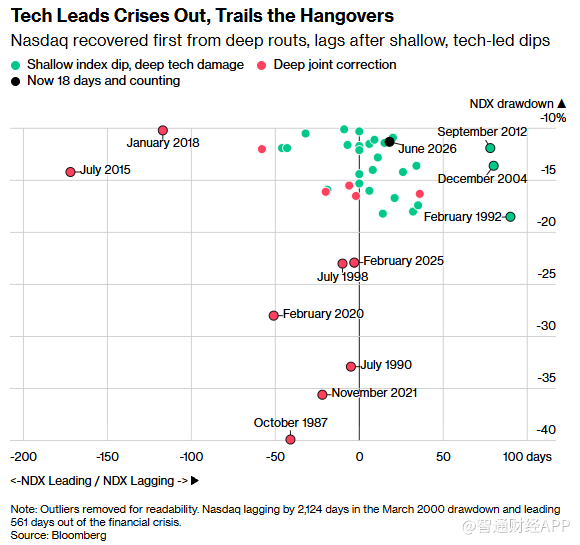
The Nasdaq 100 eventually caught up, but it took two to four months for the S&P 500 index to recover until the tech sector rebounded. Currently, the technology sector seems to have once again fallen into the latter scenario: the trend in this sector is sideways, while other sectors continue to move forward.
The money didn't leave the field; they just changed the track
Since the high on June 2, the S&P 500 index, which excludes AI components, has risen by about 8%, and the weighted S&P 500 index has risen by about 5%, yet the Nasdaq 100 index has yet to recover its decline. The semiconductor sector, which once dominated the spring rebound, became the hardest hit area of the summer “liquidation”, and software, healthcare, and travel stocks took their place. Even tech giants showed the opposite trend: Microsoft contributed about a quarter of the rebound since the July low, while Apple became the biggest drag factor in this round of recovery.
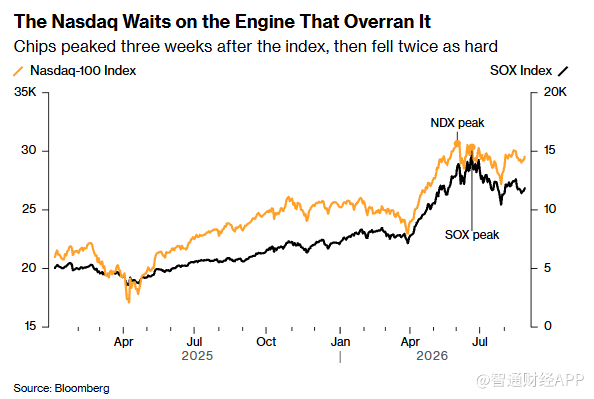
The Nasdaq 100 index peaked in June, but its “engine” did not peak at the same time. The Philadelphia Semiconductor Index continued to rise over the next three weeks, then plummeted nearly 30% during the July sell-off. Within an index that was almost repaired, a bear market was brewing, and the most popular theme retracted most violently. Despite sharp fluctuations in the internal sector, the equal-weighted S&P 500 and NASDAQ have increased by about 15% and 17%, respectively, since the beginning of the year 100, which is almost equal.
Chip stocks peaked three weeks later than NASDAQ 100
Part of the reason is the position structure. Goldman Sachs Group's Prime Services division observed that hedge funds bought on dips for three consecutive weeks until mid-August and then sold at the fastest rate in two months. The IT sector is the sector that has been sold the most so far, and the scale of deleveraging is the largest in more than two years. The fund's overall position is cautious. The net leverage ratio of the fundamental strategy is close to a one-year low. Leveraged funds spent a month closing short positions in NASDAQ futures, and long positions in net asset management have yet to fully recover.
Power and resistance coexist, when will the next new high arrive?
Meanwhile, market sentiment is being disrupted by another layer of factors: AI credit concerns are once again heating up, and may be more relevant than in July. According to the Morgan Stanley report, the share of hyperscalers (hyperscalers) in US non-financial investment-grade bond issuance has jumped from 2% in 2025 to 19% this year, involving more than $3 trillion in off-balance sheet commitments.
Nvidia handed over impressive earnings reports last week, which strongly proved the large-scale demand for AI in the market. However, even the best AI news is often difficult to sustain its popularity this summer, and the pressure on profit margins brought about by soaring memory costs is having an adverse impact on some stocks.
Furthermore, interest rates are increasingly becoming a core variable in market transactions. Federal Reserve Chairman Kevin Walsh warned in his speech at the Jackson Hole central bank's annual meeting that there has been no substantial slowdown in inflation. He added that policymakers must be convinced that inflation is slowing, otherwise the Federal Reserve still has “work to do.”
The current market consensus seems to be fractured: the AI narrative has been challenged but not yet broken. The Nasdaq 100 index has been able to recover lost ground after every pullback in the current cycle, but the basis for this rebound is narrow — support for the software sector is limited, and the chip “engine” is still deep in the quagmire. Trillions of dollars in AI spending have yet to yield clear returns, and capital costs remain unresolved. The market has both momentum and resistance; it is uncertain which side will have the upper hand.
The next high may not be far off. Since this round of the bull market, as long as the sell-off stops, the Nasdaq 100 index has always been able to recover lost ground — 12 retractions and 12 recoveries, without exception. There is currently no evidence that this rule will be broken. What has really changed is the market logic: the capital no longer sees the NASDA100 as a tool to bet on AI themes, but instead screens individual stocks one by one and carefully selects them. The problem is that there are very few stocks that can drive the index upward recently.