


The United Kingdom's market has recently faced challenges, with the FTSE 100 and FTSE 250 indices experiencing declines due to weak trade data from China, highlighting concerns about global economic recovery. As these indices reflect broader market sentiments, investors may be on the lookout for stocks that appear undervalued amidst current uncertainties. Identifying such opportunities often involves assessing companies with strong fundamentals that might be temporarily overlooked due to prevailing market conditions.
Top 10 Undervalued Stocks Based On Cash Flows In The United Kingdom
| Name | Current Price | Fair Value (Est) | Discount (Est) |
| Pan African Resources (LSE:PAF) | £1.363 | £2.61 | 47.8% |
| On the Beach Group (LSE:OTB) | £1.944 | £3.74 | 48% |
| Next 15 Group (AIM:NFG) | £3.175 | £6.27 | 49.4% |
| Kistos Holdings (AIM:KIST) | £2.80 | £5.32 | 47.4% |
| Fevara (LSE:FVA) | £1.45 | £2.89 | 49.8% |
| Eurocell (LSE:ECEL) | £1.21 | £2.27 | 46.6% |
| Entain (LSE:ENT) | £5.132 | £9.93 | 48.3% |
| Diaceutics (AIM:DXRX) | £1.435 | £2.86 | 49.8% |
| Atalaya Mining Copper (LSE:ATYM) | £11.09 | £20.87 | 46.9% |
| Accsys Technologies (AIM:AXS) | £0.714 | £1.42 | 49.6% |
Let's take a closer look at a couple of our picks from the screened companies.
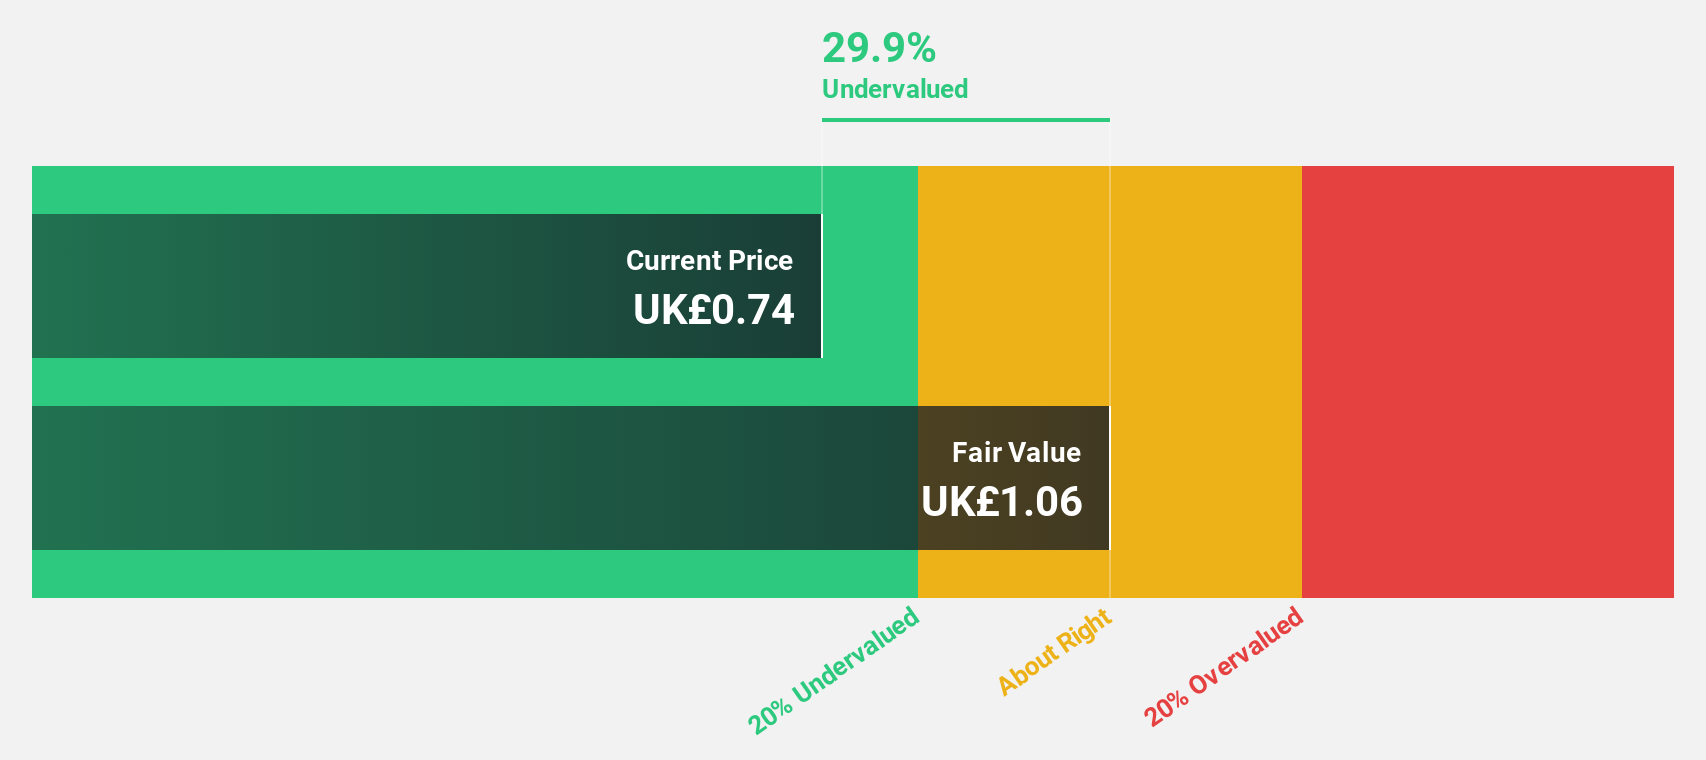
Dr. Martens (LSE:DOCS)
Overview: Dr. Martens plc is involved in the design, development, procurement, marketing, sale, and distribution of footwear with a market cap of £742.72 million.
Operations: The company's revenue primarily comes from its footwear segment, generating £764.90 million.
Estimated Discount To Fair Value: 18.4%
Dr. Martens is trading at £0.78, below its estimated future cash flow value of £0.95, suggesting it may be undervalued based on cash flows despite not meeting a significant margin threshold. Its earnings are projected to grow significantly at 30.06% annually over the next three years, outpacing the UK market's growth rate of 11.6%. However, revenue growth is modest at 4.5% per year and its dividend yield of 3.29% isn't well covered by earnings.
- Our growth report here indicates Dr. Martens may be poised for an improving outlook.
- Take a closer look at Dr. Martens' balance sheet health here in our report.
Norcros (LSE:NXR)
Overview: Norcros plc, with a market cap of £290.88 million, designs and supplies bathroom and kitchen products across the United Kingdom, South Africa, Europe, and internationally.
Operations: The company's revenue primarily comes from its Building Products segment, which generated £393.40 million.
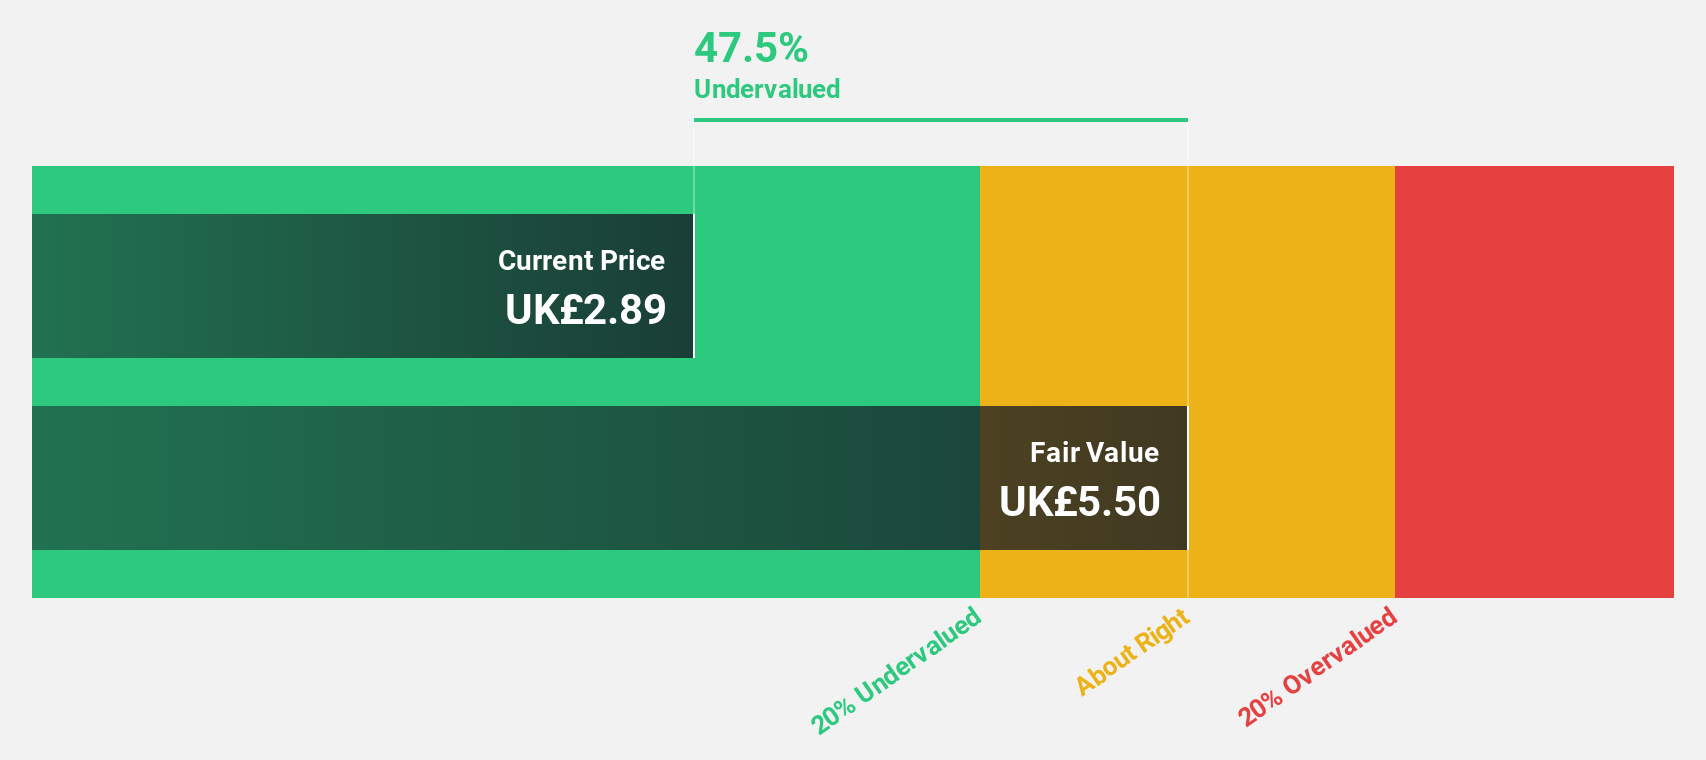
Estimated Discount To Fair Value: 36.1%
Norcros, trading at £3.26, is valued below its estimated future cash flow value of £5.10, indicating potential undervaluation based on cash flows. Earnings are forecast to grow significantly at 27.7% annually, surpassing the UK market's growth rate of 11.6%. Despite this strong earnings outlook, revenue growth is moderate at 5.6% per year and the dividend yield of 3.47% isn't well covered by earnings. Recent strategic divestments aim to focus on high-return core operations in the bathroom sector.
- Insights from our recent growth report point to a promising forecast for Norcros' business outlook.
- Get an in-depth perspective on Norcros' balance sheet by reading our health report here.
QinetiQ Group (LSE:QQ.)
Overview: QinetiQ Group plc delivers science and technology solutions in the defense, security, and infrastructure sectors across the United States, Australia, Canada, and Germany with a market cap of £2.61 billion.
Operations: The company's revenue segments include £1.53 billion from EMEA Services and £393.40 million from Global Solutions.
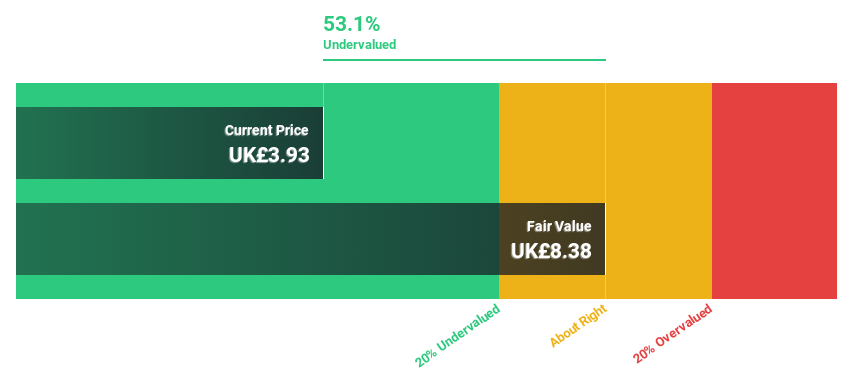
Estimated Discount To Fair Value: 33%
QinetiQ Group, trading at £5.08, is undervalued relative to its estimated future cash flow value of £7.57, with a forecasted earnings growth of 16.8% annually outpacing the UK market's 11.6%. Despite moderate revenue growth at 5.1%, the company offers a reliable dividend yield of 2.17%. The recent licensing agreement for its Q-TRED technology enhances its innovation portfolio, potentially contributing to long-term cash flow improvements and supporting its undervaluation thesis based on discounted cash flows (DCF).
- According our earnings growth report, there's an indication that QinetiQ Group might be ready to expand.
- Delve into the full analysis health report here for a deeper understanding of QinetiQ Group.
Taking Advantage
- Dive into all 50 of the Undervalued UK Stocks Based On Cash Flows we have identified here.
- Got skin in the game with these stocks? Elevate how you manage them by using Simply Wall St's portfolio, where intuitive tools await to help optimize your investment outcomes.
- Join a community of smart investors by using Simply Wall St. It's free and delivers expert-level analysis on worldwide markets.
Searching for a Fresh Perspective?
- Explore high-performing small cap companies that haven't yet garnered significant analyst attention.
- Diversify your portfolio with solid dividend payers offering reliable income streams to weather potential market turbulence.
- Fuel your portfolio with companies showing strong growth potential, backed by optimistic outlooks both from analysts and management.
This article by Simply Wall St is general in nature. We provide commentary based on historical data and analyst forecasts only using an unbiased methodology and our articles are not intended to be financial advice. It does not constitute a recommendation to buy or sell any stock, and does not take account of your objectives, or your financial situation. We aim to bring you long-term focused analysis driven by fundamental data. Note that our analysis may not factor in the latest price-sensitive company announcements or qualitative material. Simply Wall St has no position in any stocks mentioned.
Have feedback on this article? Concerned about the content? Get in touch with us directly. Alternatively, email editorial-team@simplywallst.com