


The Zhitong Finance App learned that according to the latest research data released by Goldman Sachs, short positions in the S&P 500 index constituent stocks have soared to the highest level since the 2008 financial crisis. The median short stock holdings have risen to 3.2% of the total market value, while for stocks with a concentration of bears in the 90th percentile, the number of short positions has reached 8.0% of the market value. Both indicators reversed the sluggish trend at the beginning of this century and showed significant sharp upward curves.
Data panorama: A ten-year high, but not as high as the extreme peak of the financial crisis
According to Goldman Sachs's main broker business statistics, short positions in the median constituent stocks of the S&P 500 index are equivalent to 3.2% of the total market value, which Goldman Sachs defines as a “very high” level. For stocks with short positions in the 90th percentile, this ratio is as high as 8%.
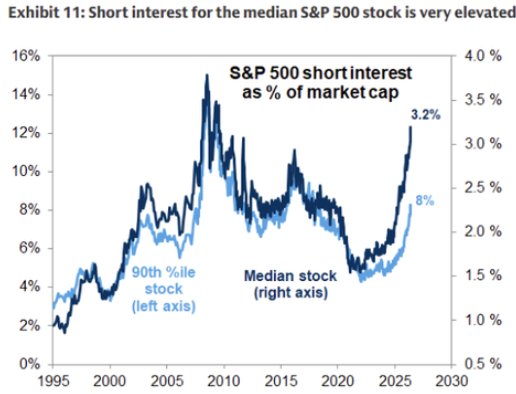
Goldman Sachs's historical comparison chart shows that although the current shorting scale has reached a new high in nearly ten years, it is still in a relatively moderate range compared to the extreme peak during the 2008-2009 global financial crisis (median short position volume reached about 3.8% at the time). However, the current level is much higher than during the Internet bubble in 2000 and the peak of the market in 2021.
The triple driving force behind the sharp rise in short positions
First, demand for macro-hedging has surged. Goldman Sachs main brokerage business data shows that short positions in US macro products (indices and ETFs) have risen to their highest level in the past ten years. Faced with geopolitical tension, rising interest rate expectations, and market concerns about seasonal weakness in US stocks in September, institutional investors are speeding up hedging by shorting individual stocks or using bearish ETFs.
Second, the defensive sector became the hardest hit area. Short bets are no longer limited to the tech sector. Although the information technology sector remains the largest concentration of net short positions, short positions in the industrial, financial, and energy sectors have also increased markedly.
Third, directional bearishness and hedging coexist. Sam Pierson, director of research at S3 Partners, stated that “short-term trends are more likely to reflect active/directional shorting.” Goldman Sachs also acknowledged that the current rise in short positions is partly driven by hedging activity and not based solely on bearish beliefs about fundamentals.
The technical side turned red, and the September spell blocked the way
J.P. Morgan's technical strategist Jason Hunt warned in a report released on August 24 that although US stocks are still close to historical highs, there are many risk signals within the market. The S&P 500 recently hit an all-time high of 7816 points, but is still below the key resistance area of 7909 points to 7935 points. Hunter pointed out that the index's momentum is slowing near the long-term channel resistance level. Recently, market leadership has shifted, and existing AI-related leading stocks are showing a weak technical pattern.
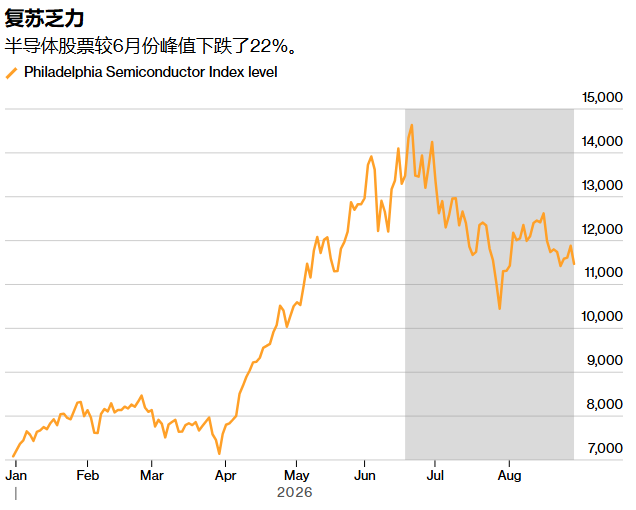
The semiconductor sector is in a particularly difficult situation. The Philadelphia Semiconductor Index (SOX) has retreated more than 21% from its high of 14,655 points in early July, meeting the definition of a “technical bear market.” By the close of August 28, SOX had fallen by 412.51 points (down 3.47%) to close at 11469.66 points. J.P. Morgan warned that the semiconductor index's current resistance zone is the dividing line between a short-term “dead cat rebound” and a restart of a multi-year upward trend. If it continues to trade below this region after Labor Day, the semiconductor index may face a new round of strong selling pressure throughout the fall.
BTIG's chief technical strategist Jonathan Klinsky further pointed out that in 2026, there have been 57 trading days where prices are contrary to market breadth trends, tied with the past two years for the highest number in nearly 30 years. So far this year, there has been no “full sell-off day” where the volume of falling transactions accounts for more than 80%. This means that the market has lacked a quick centralized clearance, and the pressure for systemic adjustments is still quietly accumulating.
Historical seasonal data provides more solid support for current market warnings. Since 1928, the average return of the S&P 500 index in September was about -1.2%. It was the only calendar month with a negative long-term average return. It recorded a decline of about 56% of the year. In the year of decline, the average pullback reached 7.35%. This seasonal weakness was more pronounced during the mid-term presidential term — in all midterm election years since 1974, the S&P 500 index had a median return of 0% from August 1 to November election day.
BTIG's data further revealed a more severe pattern in the midterm election year: since 1990, the equal-weighted S&P 500 index fell by at least 7% between August and October of each midterm election year, with the exception of 2006. The index usually peaks around August 18, then enters a rather difficult downward range until mid-October.