


Chicago, Illinois-based CME Group Inc. (CME) operates contract markets for the trading of futures and options on futures contracts worldwide. The company has a market cap of $101.4 billion and offers futures and options products based on interest rates, equity indexes, foreign exchange, and agricultural, energy, and metals commodities, among others.
Companies with a market cap of $10 billion or more are typically referred to as “large-cap stocks.” CME fits perfectly into that category, with its market cap exceeding this threshold and reflecting its substantial size and influence in the financial data and stock exchanges industry.
CME stock currently trades 14.3% below its 52-week high of $329.16, recorded on March 3. CME has grown 11.6% over the past three months, lagging behind the State Street Financial Sector SPDR ETF’s (XLF) 15.1% rise during the same time frame.
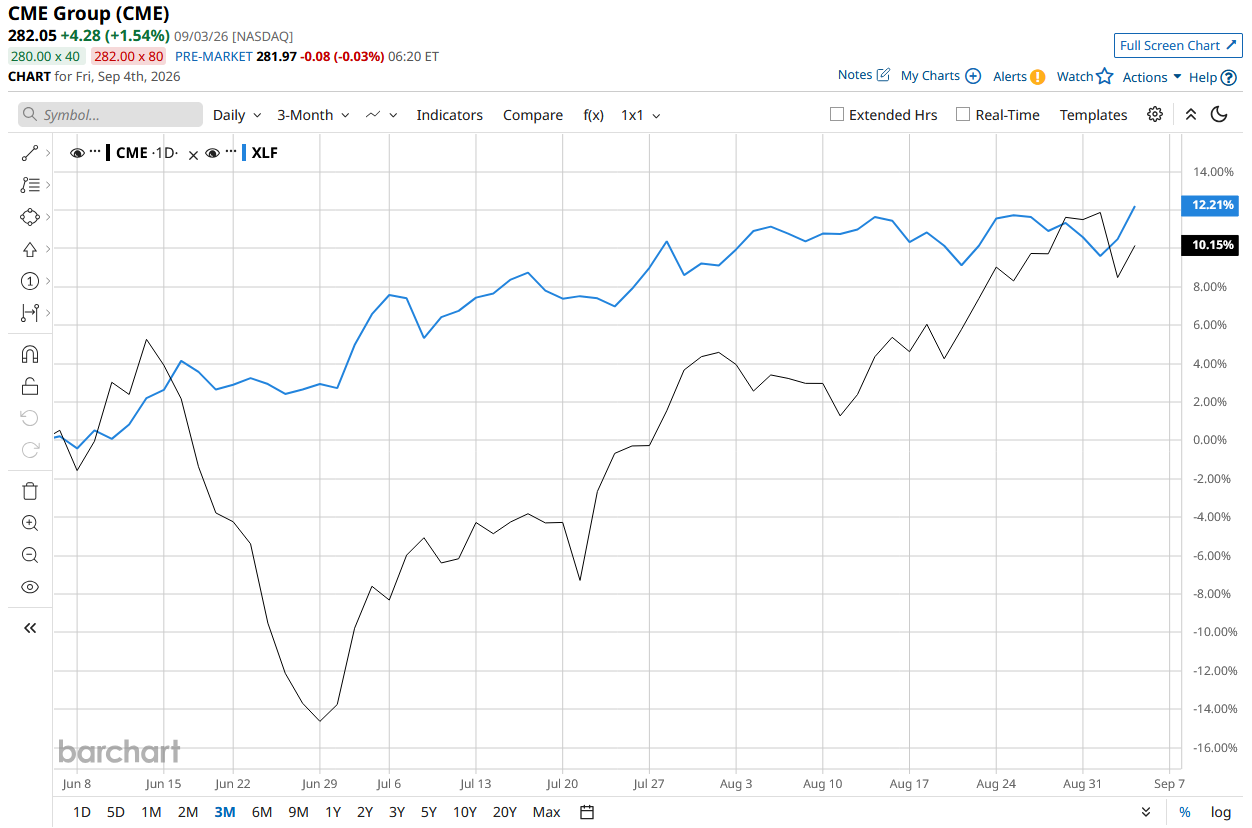
In the longer term, CME has delivered a similar performance. The stock has risen 4.7% over the past 52 weeks, underperforming the 9.7% rise of XLF over the same period. CME has been trading above its 200-day moving average since the last trading session, and above its 50-day moving average since the end of July.
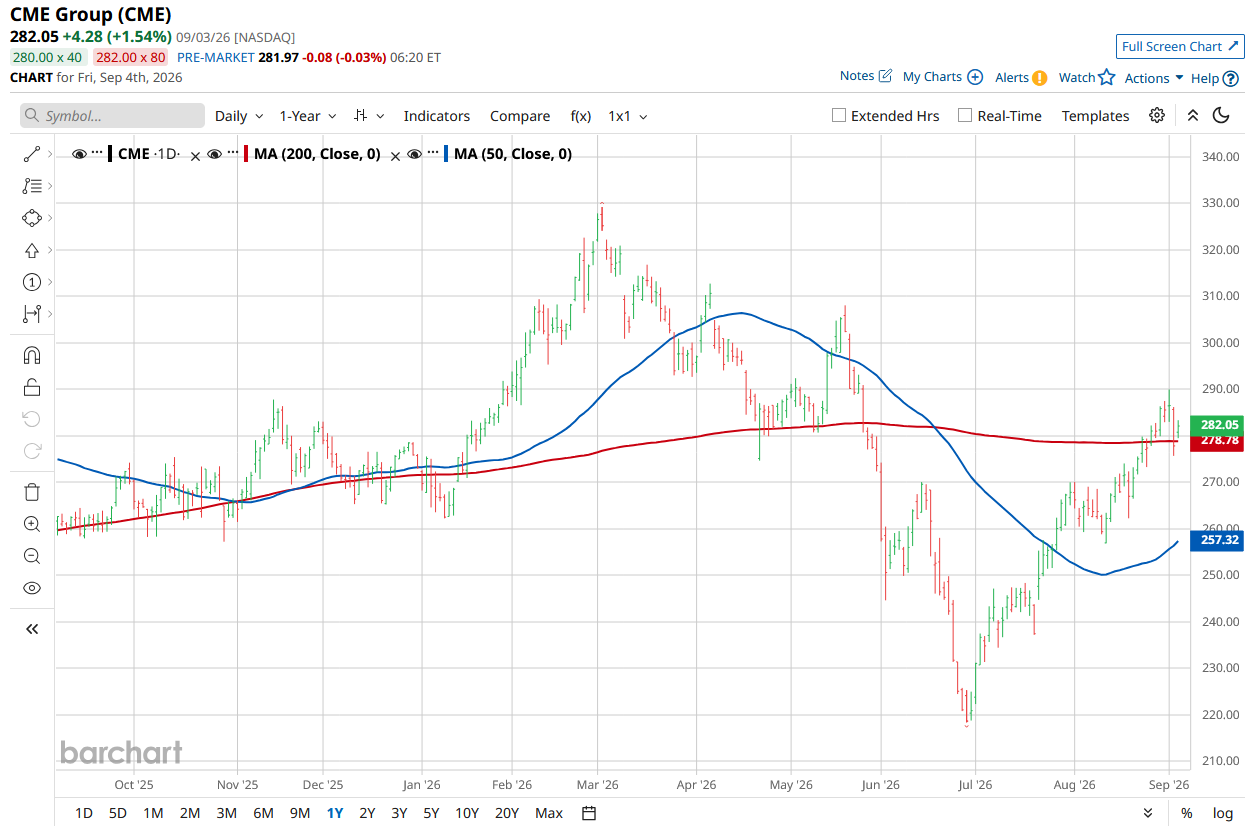
CME’s short-term bullish performance can be traced back to its better-than-expected Q2 2026 earnings. The company’s revenue for the quarter remained flat compared to the previous year’s quarter and came in at $1.7 billion, topping Wall Street’s estimates. Moreover, its adjusted EPS amounted to $2.99, also surpassing the Street’s forecasts. Following the impressive outperformance, the company’s shares rose 5% on July 22.
When stacked against its rival, Intercontinental Exchange, Inc. (ICE) has declined 6% over the past year, lagging behind CME.
Wall Street has a moderately optimistic view of the stock currently. Among the 18 analysts tracking CME, the overall consensus stands at a “Moderate Buy.” Its mean price target of $284.44 suggests a marginal upside potential from current price levels.
On the date of publication, Aritra Gangopadhyay did not have (either directly or indirectly) positions in any of the securities mentioned in this article. All information and data in this article is solely for informational purposes. For more information please view the Barchart Disclosure Policy here.