


Record earnings and carbon capture progress put REX American Resources in focus
REX American Resources (REX) has drawn fresh attention after reporting record second quarter earnings, supported by $18.4 million in 45Z tax credits and what management described as strong ethanol market conditions.
The company also received draft Class VI well permits from the EPA for its carbon capture project, an important regulatory milestone that sits alongside ethanol expansion projects that are on schedule and expected to lift production capacity by early next year.
REX American Resources shares have pulled back about 6% over the past month and 8% over the past quarter, yet the year to date share price return of 28% and 1 year total shareholder return of 34% point to momentum that has built over a longer period.
Compare REX American Resources with hand picked peers by screening for ethanol and energy producers showing strong earnings support and solid balance sheets in our list of solid balance sheet and fundamentals (52 results)
Bulls argue that record earnings, 45Z credits and carbon capture progress leave REX American Resources looking mispriced after the recent pullback. Bears point to policy risk and ethanol cyclicality. Which side does the current valuation support?
Price-to-earnings of 11.4x for REX American Resources: Is it justified?
REX American Resources closed at $41.46, while its P/E ratio of 11.4x sits well below both its peer average of 24.4x and the broader US Oil and Gas industry average of 12.8x. That gap suggests the market is currently assigning a lower price tag to each dollar of earnings than it does for many comparable producers.
The P/E ratio compares the current share price with earnings per share and is a common shorthand for how much investors are willing to pay for current profitability. For a company like REX American Resources, which is focused on ethanol and related products, this metric can be particularly useful because earnings are a direct output of commodity spreads, efficiency and tax credits such as the 45Z support it is receiving.
REX is assessed as good value on this preferred multiple relative to both its direct peer group at 24.4x and the US Oil and Gas industry average of 12.8x. Given earnings growth of 134.6% over the past year, profit margins of 17.6% compared with 7.9% a year earlier and an assessment of high quality earnings, the current P/E of 11.4x implies the market is applying a more conservative earnings multiple than it does to many peers with lower recent growth.
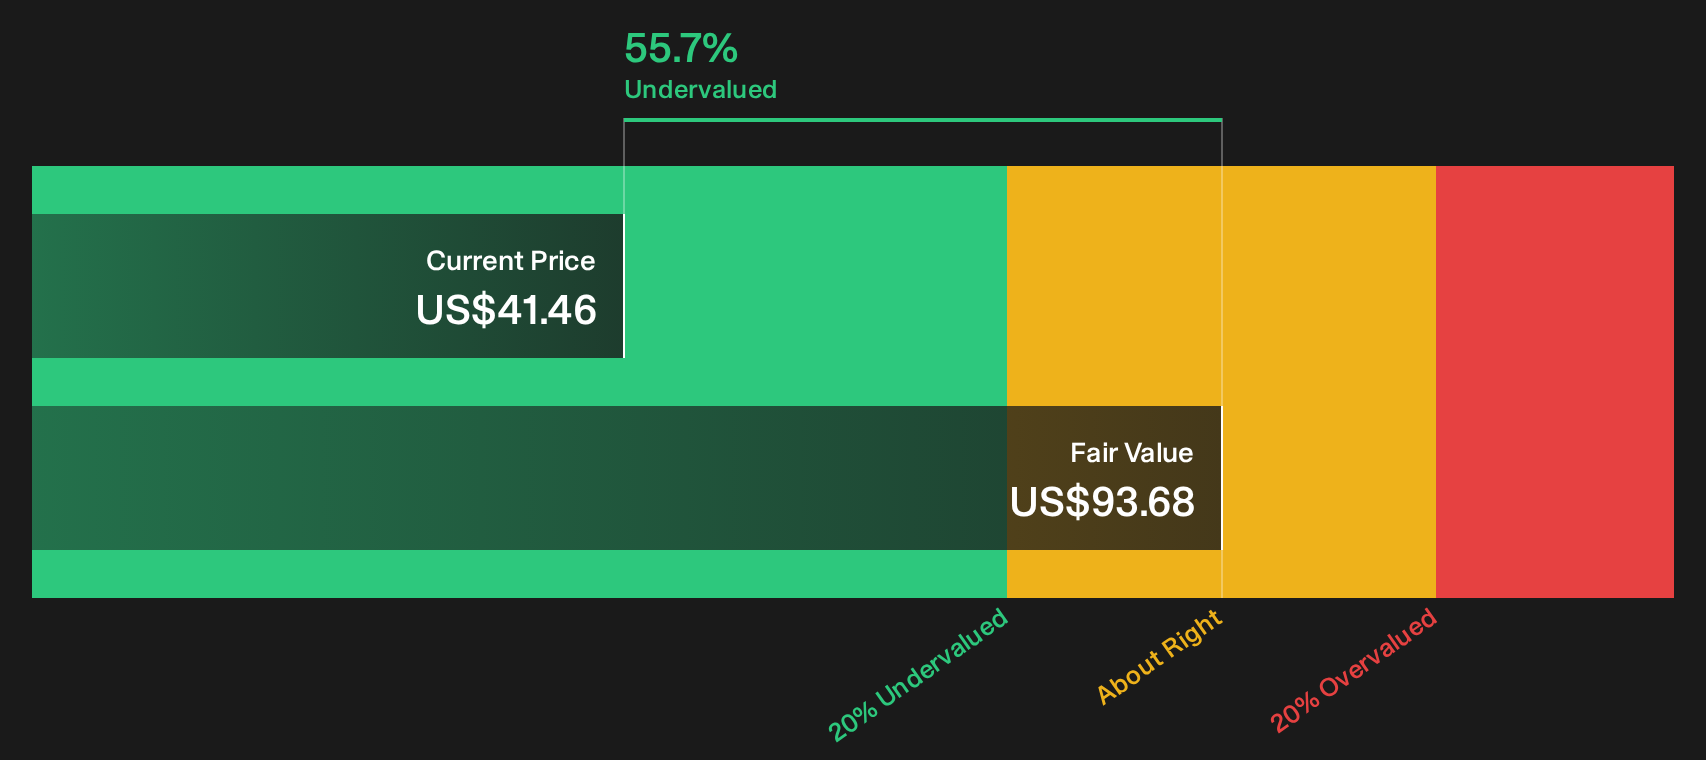
The SWS DCF model provides a second reference point, with an estimate of future cash flow value of $93.68 per share compared with the current $41.46 price. This implies a very wide gap between the modelled value of future cash flows and where the stock trades today. Investors who put more weight on cash flow based valuation than on simple earnings multiples may judge that DCF output differently, but it underlines how compressed the current market pricing is against at least one forward looking framework.
See what the numbers say about this price — find out in our valuation breakdown.
Result: Price-to-earnings of 11.4x (UNDERVALUED)
However, the bullish REX American Resources story can quickly change if ethanol market conditions weaken or if policy support around 45Z credits and carbon capture shifts.
Find out about the key risks to this REX American Resources narrative.
Another view on REX American Resources valuation
The SWS DCF model offers a very different lens on REX American Resources. It points to a future cash flow value of $93.68 per share compared with the current $41.46 price. On this framework, the stock appears deeply undervalued. If earnings or policy drivers change, does that gap still feel comfortable?
Look into how the SWS DCF model arrives at its fair value.
Simply Wall St performs a discounted cash flow (DCF) on every stock in the world every day (check out REX American Resources for example). We show the entire calculation in full. You can track the result in your watchlist or portfolio and be alerted when this changes, or use our stock screener to discover 47 high quality undervalued stocks. If you save a screener we even alert you when new companies match - so you never miss a potential opportunity.
Next Steps
If the mixed signals on REX American Resources leave you unsure, take a closer look at both sides of the story, including the 2 key rewards and 1 important warning sign
Looking for more investment ideas beyond REX American Resources?
If REX American Resources has sharpened your focus on valuation and quality, do not stop there. Broader ideas can help you build a more resilient portfolio.
- Target resilience by filtering for companies with strong finances and durable balance sheets through our list of solid balance sheet and fundamentals (52 results).
- Hunt for quality at a discount by scanning companies that combine solid fundamentals with attractive pricing using our 19 high quality undiscovered gems.
- Prioritise steadier return profiles by focusing on companies with lower risk characteristics using our 82 resilient stocks with low risk scores.
This article by Simply Wall St is general in nature. We provide commentary based on historical data and analyst forecasts only using an unbiased methodology and our articles are not intended to be financial advice. It does not constitute a recommendation to buy or sell any stock, and does not take account of your objectives, or your financial situation. We aim to bring you long-term focused analysis driven by fundamental data. Note that our analysis may not factor in the latest price-sensitive company announcements or qualitative material. Simply Wall St has no position in any stocks mentioned.
Have feedback on this article? Concerned about the content? Get in touch with us directly. Alternatively, email editorial-team@simplywallst.com