


Honeywell Aerospace stock has fallen sharply this year, yet several valuation checks suggest the current share price may sit well below a reasonable estimate of intrinsic value. For investors, the interest lies in whether a weaker share price is lining up with what the fundamentals-based models imply.
- Year to date, Honeywell Aerospace is down 19.5%, which means recent price performance has been firmly negative even before considering valuation inputs.
- Future cash flow delivery can support the current valuation case if Honeywell Aerospace converts its order book into steady cash generation. Any setback in cash flow or margin quality may weigh heavily on what investors are willing to pay for the stock.
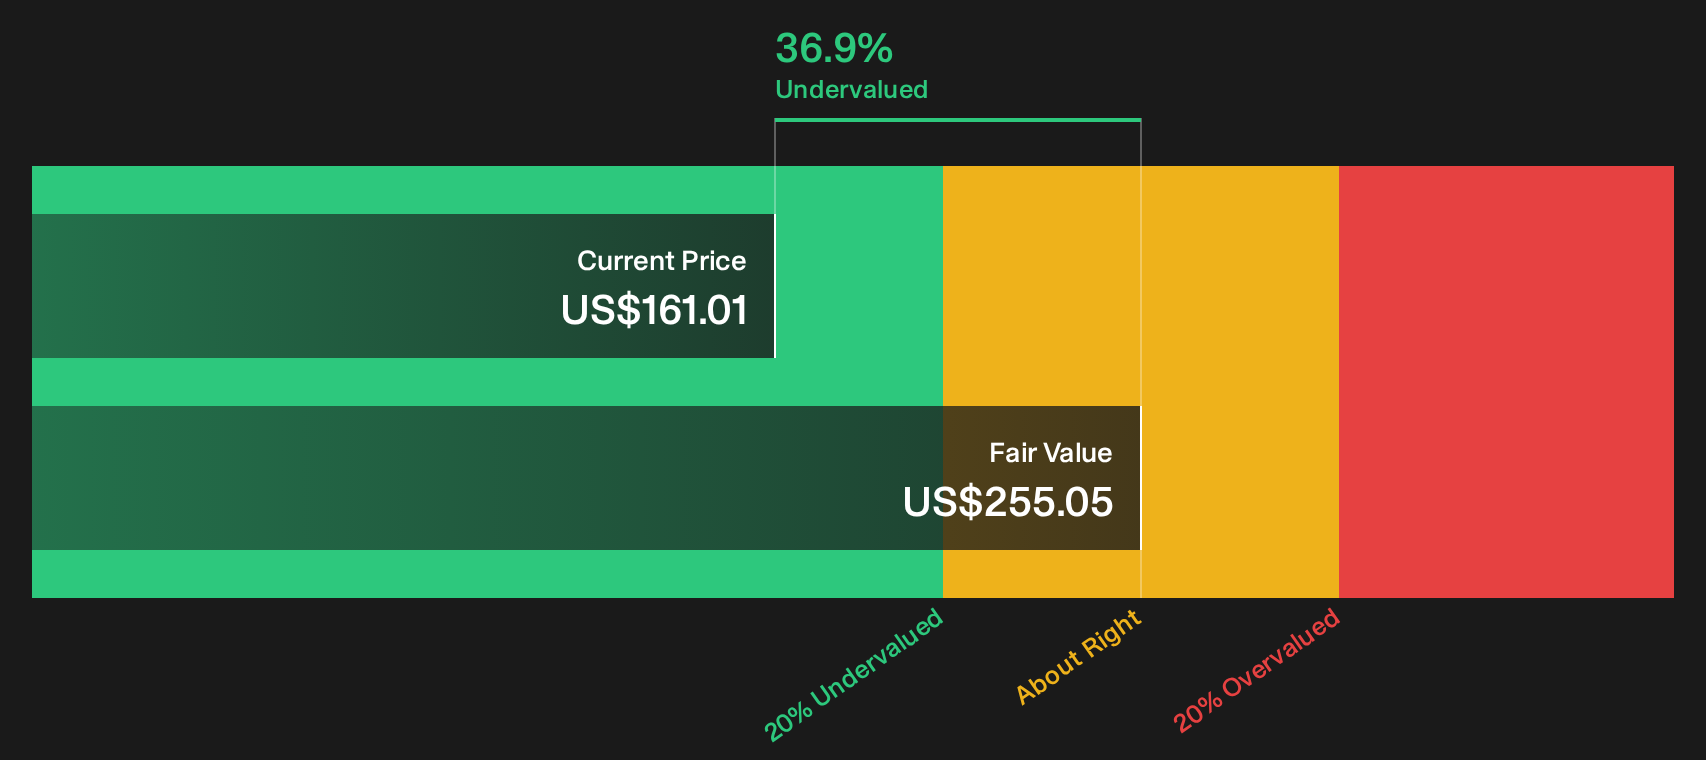
- A Discounted Cash Flow (DCF) intrinsic value estimate sits about 36.9% above the current price and the company screens as undervalued on most checks. Together, these factors point to a broader set of signals that lean cheap for Honeywell Aerospace.
The issue now is whether Honeywell Aerospace’s weaker share price already reflects its risks or if the intrinsic value signals are pointing to a gap that may eventually close.
Compare Honeywell Aerospace's recent pullback with other stocks that also screen as potentially cheap on fundamentals by scanning 47 high quality undervalued stocks for your next research short list.
Is Honeywell Aerospace Still Cheap on Cash Flow?
The Discounted Cash Flow (DCF) approach values Honeywell Aerospace by estimating the cash it can return to shareholders over time, then discounting those flows back to today. On this model, the company is generating latest twelve month free cash flow of about $2.49b, and the projections assume growing cash flows from this base rather than a decline.
Feeding those assumptions into a 2 Stage Free Cash Flow to Equity model produces an estimated intrinsic value of about $255 per share in $ terms. That sits roughly 36.9% above the current share price, which points to Honeywell Aerospace stock screening as undervalued on this DCF view even after the recent share price pullback.
On these cash flow assumptions, Honeywell Aerospace looks undervalued relative to the intrinsic value implied by the DCF model.
Our Discounted Cash Flow (DCF) analysis suggests Honeywell Aerospace is undervalued by 36.9%. Track this in your watchlist or portfolio, or discover 47 more high quality undervalued stocks.
Is Honeywell Aerospace a Bargain on Earnings?
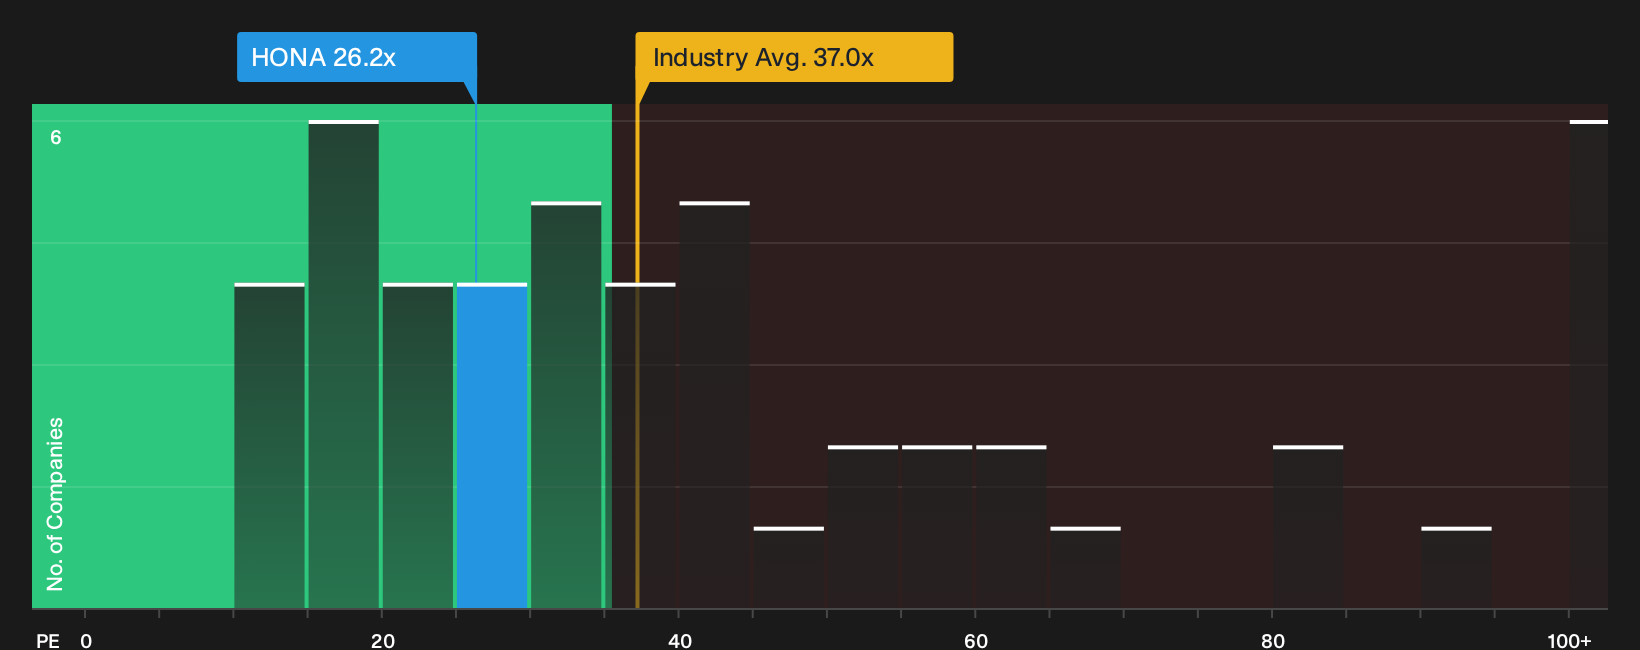
P/E is a useful cross check for Honeywell Aerospace because earnings are a key anchor for how the market typically values established industrial and aerospace companies. On this measure, Honeywell Aerospace currently trades on a P/E of about 26.2x. That is below both the broader Aerospace & Defense industry average of around 37.0x and the peer group average of roughly 32.3x.
This gap suggests the market is pricing Honeywell Aerospace at a discount to many sector peers despite a similar business footprint. Combined with the earlier DCF work that points to a higher intrinsic value estimate, the current earnings multiple indicates that the stock appears on the cheaper side within its industry.
Considered together, Honeywell Aerospace stock appears inexpensive on its current P/E multiple relative to typical levels in the Aerospace & Defense sector.
See what the numbers say about this price — find out in our valuation breakdown.
The Honeywell Aerospace Narrative: What Would Justify Today's Price?
Simply Wall St Narratives for Honeywell Aerospace pick up where the valuation checks leave off. They spell out which paths for growth, margins and earnings would make the stock worth materially more or materially less than today's price, and they sit on the company's Community page. Each narrative links its number to a specific view on how Honeywell Aerospace's growth, profitability and risks could evolve, which you can revisit as new information comes through.
Add your own narrative on Honeywell Aerospace's stock to present a clear, number-driven view of its growth, margins, and execution from this point forward. Share your thesis with the Simply Wall St community and see how it holds up as new data becomes available.
Do you think there's more to the story for Honeywell Aerospace? Head over to our Community to see what others are saying!
The Bottom Line
Honeywell Aerospace screens as undervalued on both the Discounted Cash Flow (DCF) intrinsic value estimate and its current P/E relative to sector peers, which makes the stock interesting for valuation focused investors. With these methods broadly pointing in the same direction, the key question is whether Honeywell Aerospace can deliver the cash flow and earnings that the intrinsic value work assumes. The crux of the bull versus bear debate is whether margins and cash generation stay robust enough for the market to eventually narrow the current discount, rather than treating it as a value trap.
This article by Simply Wall St is general in nature. We provide commentary based on historical data and analyst forecasts only using an unbiased methodology and our articles are not intended to be financial advice. It does not constitute a recommendation to buy or sell any stock, and does not take account of your objectives, or your financial situation. We aim to bring you long-term focused analysis driven by fundamental data. Note that our analysis may not factor in the latest price-sensitive company announcements or qualitative material. Simply Wall St has no position in any stocks mentioned.
Have feedback on this article? Concerned about the content? Get in touch with us directly. Alternatively, email editorial-team@simplywallst.com