


TXNM Energy taps equity markets with $400 million follow-on offer
TXNM Energy (TXNM) has moved to raise fresh capital, completing a roughly $400 million follow-on equity offering of common stock, a financing step that matters for both its balance sheet and existing shareholders.
The utility issued 7,079,646 new common shares at a price of $56.50, with each share priced at a $0.565 discount to the offer level. This indicates management’s willingness to accept modest dilution in exchange for additional funding capacity.
TXNM Energy’s share price has inched higher in recent weeks, with a 90 day share price return of 1.11%, while long term investors are sitting on a 3 year total shareholder return of 44.94%. This suggests that momentum has cooled after earlier gains.
Compare TXNM Energy’s move to raise equity with peers making similar capital decisions by scanning our hand picked list of solid balance sheet and fundamentals (24 results) for potential alternatives in the same space.
Fresh equity now on the table and TXNM Energy trading close to analysts’ targets raises a simple tension. Is most of the easy upside already gone, or does dilution today still leave room for more value ahead?
Price-to-earnings of 32.6x for TXNM Energy: Is it justified?
At roughly $58.09 per share, TXNM Energy is trading on a P/E of 32.6x, which screens as expensive against both peers and the wider US Electric Utilities industry.
P/E compares what investors pay today for each dollar of current earnings. For a regulated utility like TXNM Energy, this ratio often reflects expectations for steady profit growth, visibility of cash flows and how dependable regulators and customer demand are perceived to be.
TXNM Energy has some support for a richer valuation. Earnings rose 10.4% over the past year, beating the sector’s 9.1%. Profit growth over the last twelve months also exceeded its own 5 year average, where earnings declined 2.5% per year. That points to an improvement in the earnings story rather than a one way slide.
The P/E gap compared with peers is still wide. TXNM Energy trades at 32.6x earnings, while the peer average sits at 21.4x and the US Electric Utilities group averages 20.5x. Investors are paying a clear premium for TXNM Energy relative to similar stocks in the sector.
See what the numbers say about this price — find out in our valuation breakdown.
Result: Price-to-earnings of 32.6x (OVERVALUED)
Still, TXNM Energy carries clear pressure points, including equity dilution from the fresh share issue and regulatory decisions in Texas and New Mexico that could tighten returns.
Find out about the key risks to this TXNM Energy narrative.
Another view on TXNM Energy’s value
The rich P/E story for TXNM Energy appears to be at odds with our DCF work. Our SWS DCF model points to a future cash flow value of about $28.26 per share, while the stock trades near $58. That gap signals an overvalued outcome using this second lens and raises the question of which signal to trust.
Look into how the SWS DCF model arrives at its fair value.
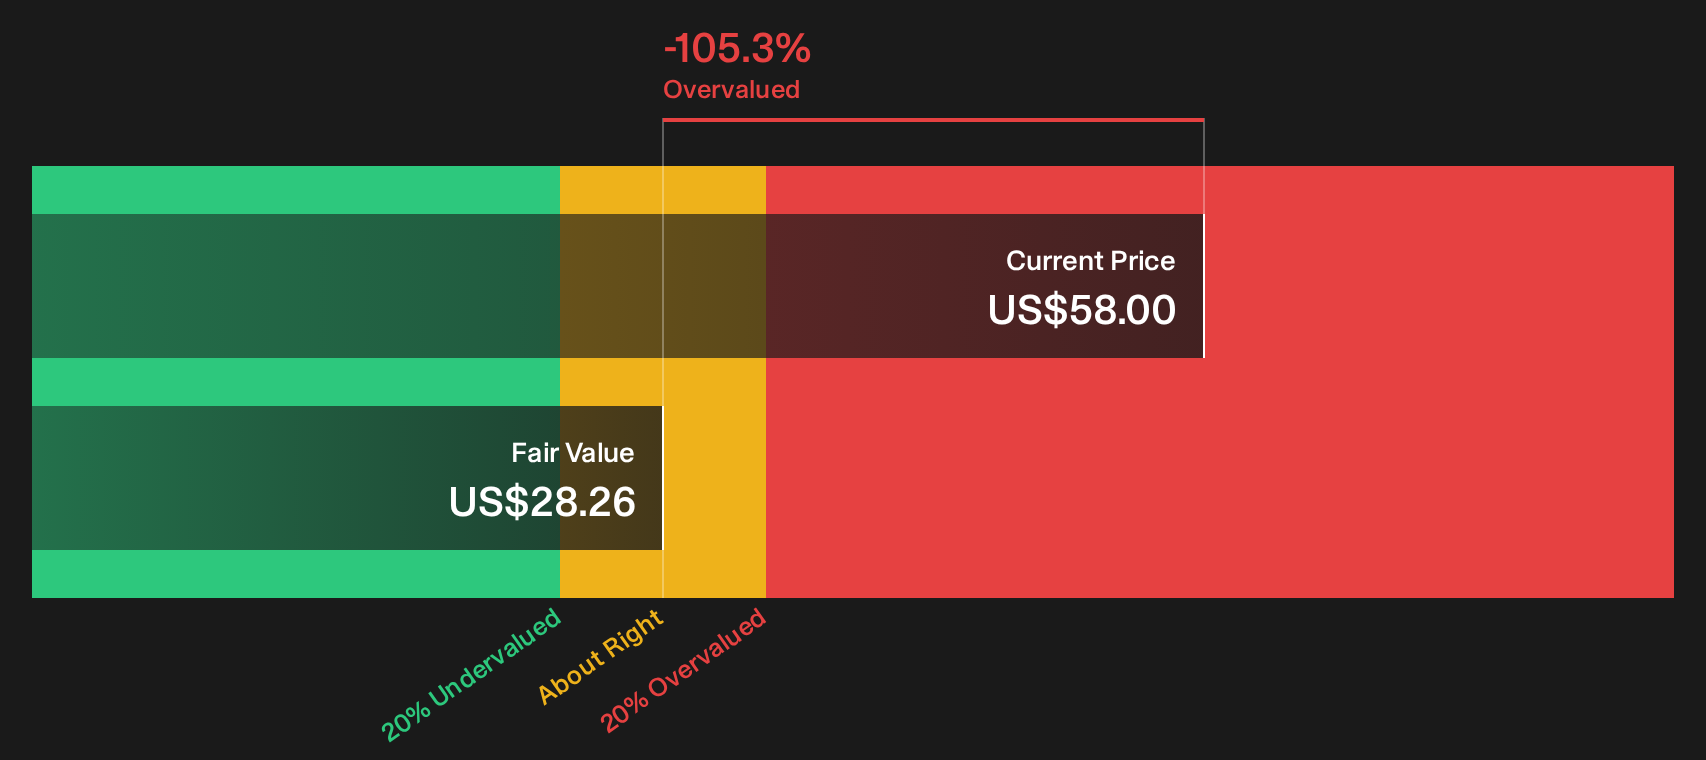
Simply Wall St performs a discounted cash flow (DCF) on every stock in the world every day (check out TXNM Energy for example). We show the entire calculation in full. You can track the result in your watchlist or portfolio and be alerted when this changes, or use our stock screener to discover 48 high quality undervalued stocks. If you save a screener we even alert you when new companies match - so you never miss a potential opportunity.
Next Steps
Mixed signals on TXNM Energy so far, with both concerns and bright spots in the story. Consider moving quickly, reviewing the data in full, and weighing the 1 key reward and 3 important warning signs.
Looking for more TXNM Energy investment ideas?
TXNM Energy might already be on your radar, but you give yourself a real edge when you line it up against other high quality opportunities using targeted screeners.
- Zero in on quality at a discount by scanning our 48 high quality undervalued stocks and see which companies currently trade below their underlying fundamentals.
- Prioritise resilience and sleep easier at night by checking the 83 resilient stocks with low risk scores that highlight businesses with stronger risk profiles.
- Spot future market leaders early by reviewing the 17 high quality undiscovered gems before the wider crowd pays attention.
This article by Simply Wall St is general in nature. We provide commentary based on historical data and analyst forecasts only using an unbiased methodology and our articles are not intended to be financial advice. It does not constitute a recommendation to buy or sell any stock, and does not take account of your objectives, or your financial situation. We aim to bring you long-term focused analysis driven by fundamental data. Note that our analysis may not factor in the latest price-sensitive company announcements or qualitative material. Simply Wall St has no position in any stocks mentioned.
Have feedback on this article? Concerned about the content? Get in touch with us directly. Alternatively, email editorial-team@simplywallst.com