


AbbVie (ABBV) is back in focus after reporting positive Phase 3 CERVINO data for etentamig in relapsed or refractory multiple myeloma, raising fresh questions about how this pipeline asset fits into the stock’s story.
Trading at US$250.91, AbbVie has given investors an 11.63% 90 day share price return and a 22.23% 1 year total shareholder return. The pullback of 4.13% over the past week looks more like a pause as fresh drug data, acquisitions and regulatory updates reset expectations around future oncology and immunology contributions.
Review how AbbVie’s oncology and immunology story compares with other large-cap drug makers by exploring our curated list of list of solid balance sheet and fundamentals (24 results)
AbbVie now trades close to its highs after a strong run, and it has just taken another step forward in oncology. Does that recent 4% pullback still leave enough potential benefit to justify the risk on valuation grounds?
Most Popular Narrative: 8.2% Undervalued
On the widely followed narrative view, AbbVie’s fair value sits at about $273 per share, above the recent $250.91 price, which puts more attention on how that gap is being justified.
Advancements and strategic investments in neuroscience, including strong uptake of Vraylar, QULIPTA, Ubrelvy, and the emerging Parkinson''s portfolio (e.g., VYALEV), align with growing demand for therapies addressing chronic neurological diseases in an aging population, supporting both revenue and long-term earnings stability.
Read the complete narrative. Read the complete narrative.
Want to understand why this framework points to a higher value for AbbVie? The model leans heavily on compounding earnings, firming margins, and a richer profit base several years out.
Result: Fair Value of $273.39 (UNDERVALUED)
Have a read of the narrative in full and understand what's behind the forecasts.
Still, AbbVie’s heavy reliance on a concentrated immunology and neuroscience portfolio, along with ongoing pricing and patent pressure, could quickly challenge that undervaluation story.
Find out about the key risks to this AbbVie narrative.
Another View: AbbVie Looks Expensive On Earnings
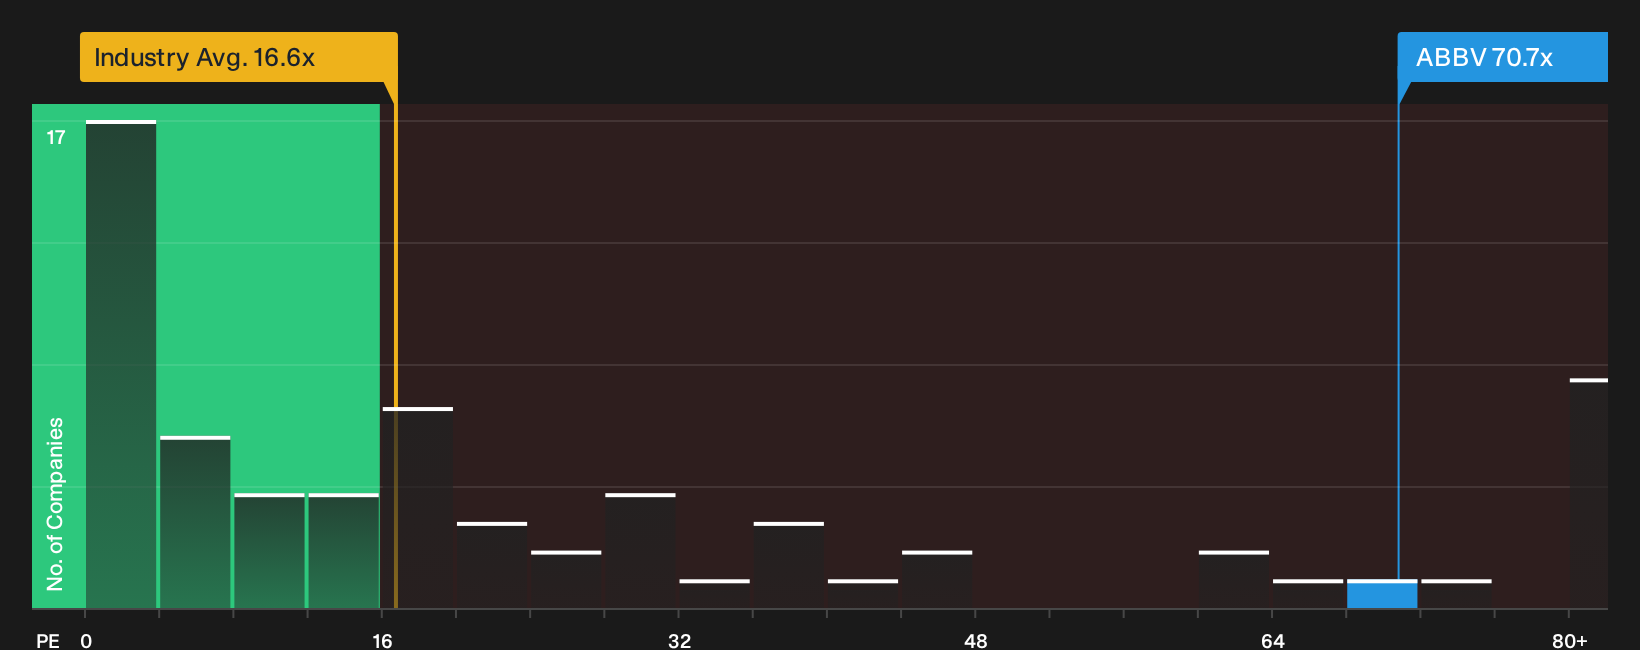
On a simpler earnings yardstick, AbbVie tells a very different story from the SWS DCF model. The stock trades on a P/E of 70.7x, while the US Biotechs industry sits near 16.6x and close peers average about 27.5x. The fair ratio sits lower again at 42.8x.
That means AbbVie carries a rich earnings multiple relative to both its sector and the fair ratio the market could move toward. This raises the question of how much future progress is already reflected in today’s price.
See what the numbers say about this price — find out in our valuation breakdown.
Next Steps
The messages on AbbVie appear mixed so far. Consider the full data set, weigh both sides carefully, then review the 3 key rewards and 4 important warning signs.
Looking for more investment ideas beyond AbbVie?
If AbbVie has your attention, do not stop there. Use the screener tools to quickly spot other opportunities that match your risk, income, and quality preferences.
- Target reliable cash generators and capital strength by scanning our list of solid balance sheet and fundamentals (24 results) that already clear strict balance sheet and fundamentals checks.
- Hunt for mispriced opportunities where quality and valuation line up by reviewing the 49 high quality undervalued stocks that could fit a disciplined watchlist.
- Build a steadier income stream by focusing on the 6 dividend fortresses that combine higher yields with a focus on resilience and payout support.
This article by Simply Wall St is general in nature. We provide commentary based on historical data and analyst forecasts only using an unbiased methodology and our articles are not intended to be financial advice. It does not constitute a recommendation to buy or sell any stock, and does not take account of your objectives, or your financial situation. We aim to bring you long-term focused analysis driven by fundamental data. Note that our analysis may not factor in the latest price-sensitive company announcements or qualitative material. Simply Wall St has no position in any stocks mentioned.
Have feedback on this article? Concerned about the content? Get in touch with us directly. Alternatively, email editorial-team@simplywallst.com